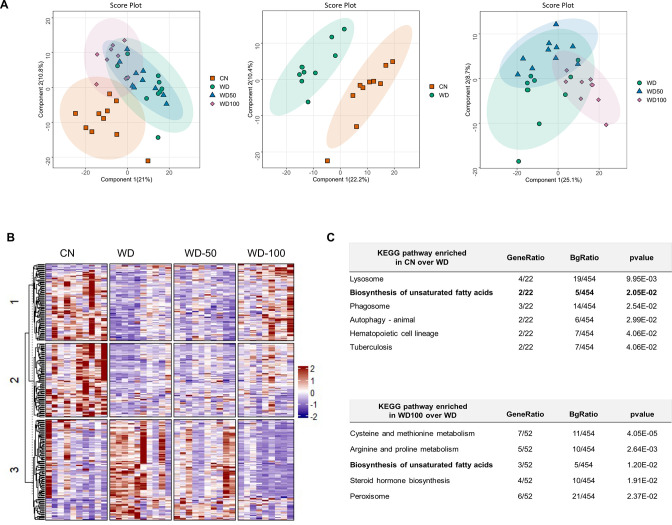
Figure 4. Indole-3-acetate (I3A) administration partially reverses diet-induced proteome alterations in the liver.
(A) Scatter plots of latent variable projections from PLS-DA of confidently identified proteins. Comparison of all four experimental groups (left panel), control mice (CN) vs Western diet (WD) group (middle panel), and WD vs. WD-50 and WD-100 groups (right panel). (B) Heatmap of significant proteins having variable importance in projection score >1.2. The proteins were clustered using k-means. (C) Pathway enrichment analysis of significant proteins differentially abundant in CN vs. WD comparison (upper panel) and WD-100 vs. WD comparison (lower panel). GeneRatio divides the number of significantly altered proteins that are in the pathway by the total number of significantly altered proteins. BGRatio divides the number of proteins that are in the pathway by the number of all detected proteins. The p-value was calculated using Fisher’s exact test.


