. 2024 Feb 27;12:RP87458. doi: 10.7554/eLife.87458

Figure 6. Indole-3-acetate (I3A) modulates AMP-activated protein kinase (AMPK) phosphorylation and suppresses RAW264.7 macrophage cell inflammation in an AMPK-dependent manner.

(A, B) I3A administration reverses Western diet (WD)-induced reduction in liver p-AMPK and AMPK. (A) Levels of p-AMPK and AMPK in liver tissue at week 16 as determined by western blot analysis. (B) Ratios of p-AMPK (left panel) and AMPK (right panel) to β-actin. The ratios were determined based on the p-AMPK and AMPK band intensities quantified using Image Lab (Bio-Rad) and normalized to the loading control (β-actin). Data shown are mean ± SEM. **: p<0.01 using Wilcoxon rank sum test. (C) Expression levels of p-AMPK and total AMPK in RAW 264.7 macrophages pre-treated with either I3A or vehicle (DMF) control followed by stimulation with palmitate and LPS, determined by western blot analysis. (D) Fold-changes in p-AMPK and total AMPK. Fold-changes were calculated relative to the DMF and no palmitate and LPS stimulation condition. The band intensities were quantified and normalized to loading control (β-actin) by using Image Lab (Bio-Rad). (E) Expression levels of Tnfa and Il1b in RAW 264.7 cells treated with p-AMPK activator 5-aminoimidazole-4-carboxamide ribonucleotide (AICAR), followed by stimulation with palmitate and LPS. (F) Expression levels of Tnfa (top row) and Il1b (bottom row) in RAW 264.7 cells transduced with non-targeted control siRNA (left panels) or Prkaa1 siRNA (middle panels), pre-treated with I3A, and then stimulated with palmitate and LPS. Data shown are mean ± SEM from three independent cultures with three biological replicates. *: p<0.05, **: p<0.01, ***: p<0.001 using Student’s t-test.

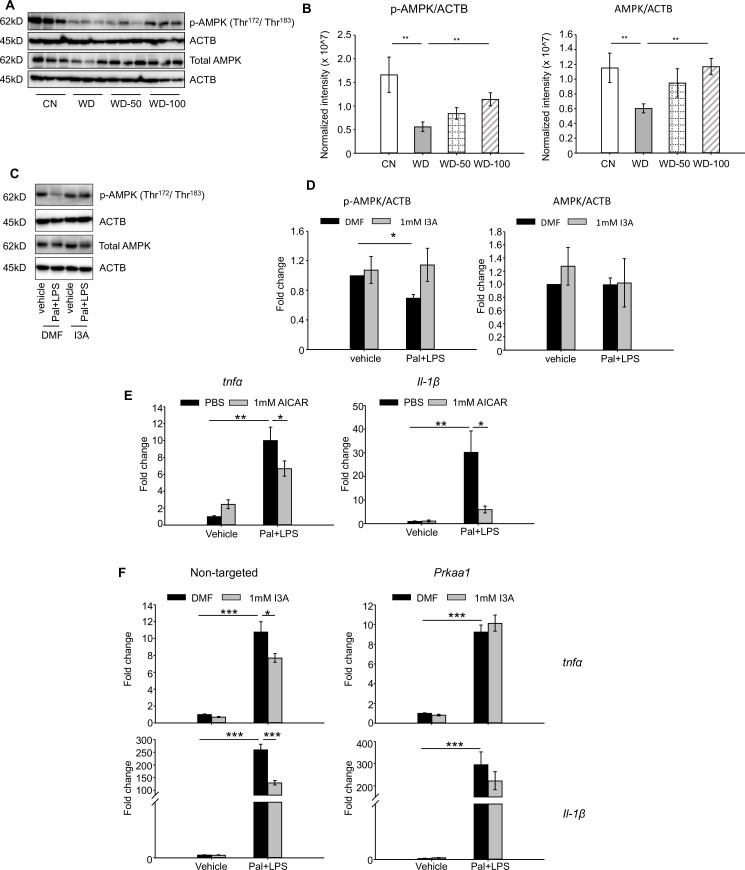
Figure 6—source data 1. Western blot analysis of p-AMPK and AMPK levels in mice liver tissues used in Figure 6A.
Figure 6—source data 2. Western blot analysis of p-AMPK and AMPK levels in RAW264.7 cells used in Figure 6C.

Figure 6.

Figure 6—figure supplement 1. Anti-inflammatory effects of I3A on RAW264.7 cells is independent of AhR.

Figure 6—figure supplement 1.

(A) Expression level of aryl-hydrocarbon receptor (AhR) in RAW264.7 and AML12 cells determined by western blot analysis. (B) Raw 264.7 cells were treated with 1 mM indole-3-acetate (I3A) (or DMF solvent control) for 4 hr, then stimulated with 300 µM palmitate for 18 hr and 10 ng/ml LPS for 6 hr (two-hit model). The AhR inhibitor CH223191 (5 µM) or DMSO control was added 10 min before I3A treatment. Total RNA was isolated from the cells and the expression of Tnfa and Il1b was measured with qRT-PCR. (C) Tnfa and Il1b expression was plotted as fold-change normalized to the DMF control group. Data presented as the mean ± SEM. ***: p<0.001 using Student’s t-test.
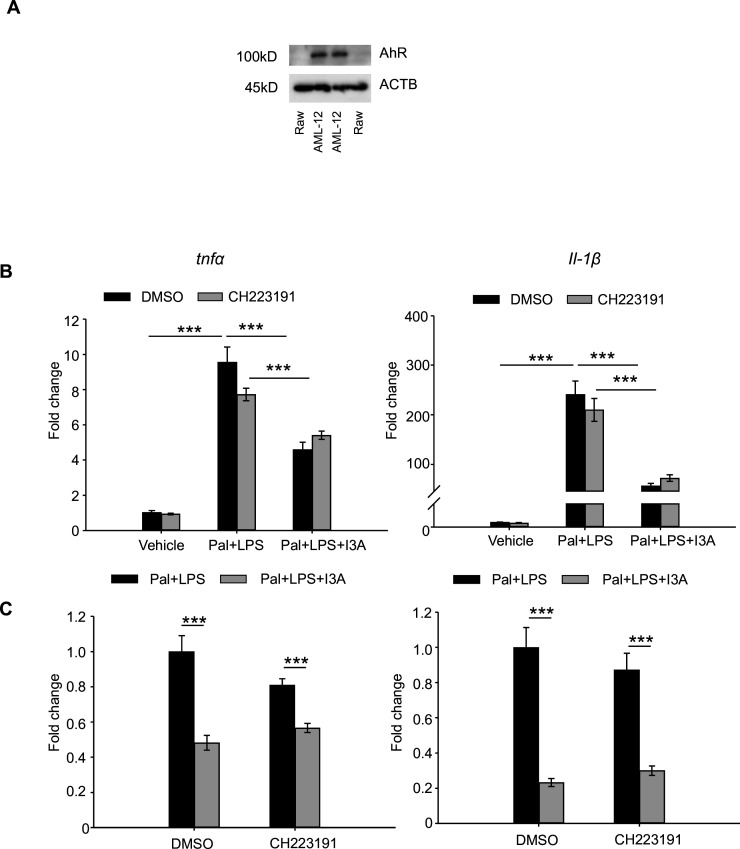
Figure 6—figure supplement 1—source data 1. Western blot analysis of AhR level in AML12 and RAW264.7 cells used in Figure 6—figure supplement 1A.
Figure 6—figure supplement 2. Knockdown of AMP-activated protein kinase (AMPK) by siRNA transfection.

Figure 6—figure supplement 2.

(A) Levels of prkaa1 mRNA in RAW 264.7 cells transfected with prkaa1 or non-targeted control siRNA for 24 hr, followed by incubation for an additional 24, 48, and 72 hr. The expression level of prkaa1 is normalized to that of the housekeeping gene β-actin. (B) Western blot analysis of p-AMPK and total AMPK from cells treated with the different siRNA. A representative blot is shown. (C) Quantified intensities of p-AMPK and total AMPK bands normalized to loading control (β-actin). *: p<0.05, **: p<0.01, ***: p<0.001 using Student’s t-test.
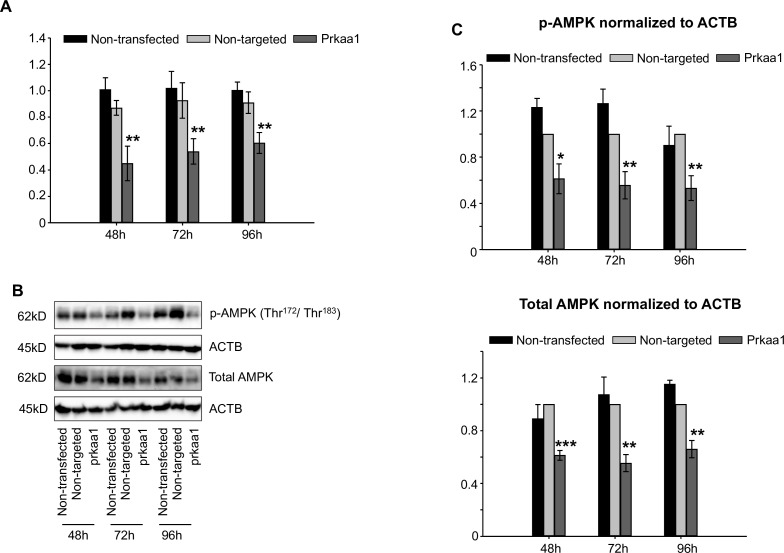
Figure 6—figure supplement 2—source data 1. Western blot analysis of p-AMPK and AMPK levels in RAW264.7 cells treated with siRNAs used in Figure 6—figure supplement 2B.
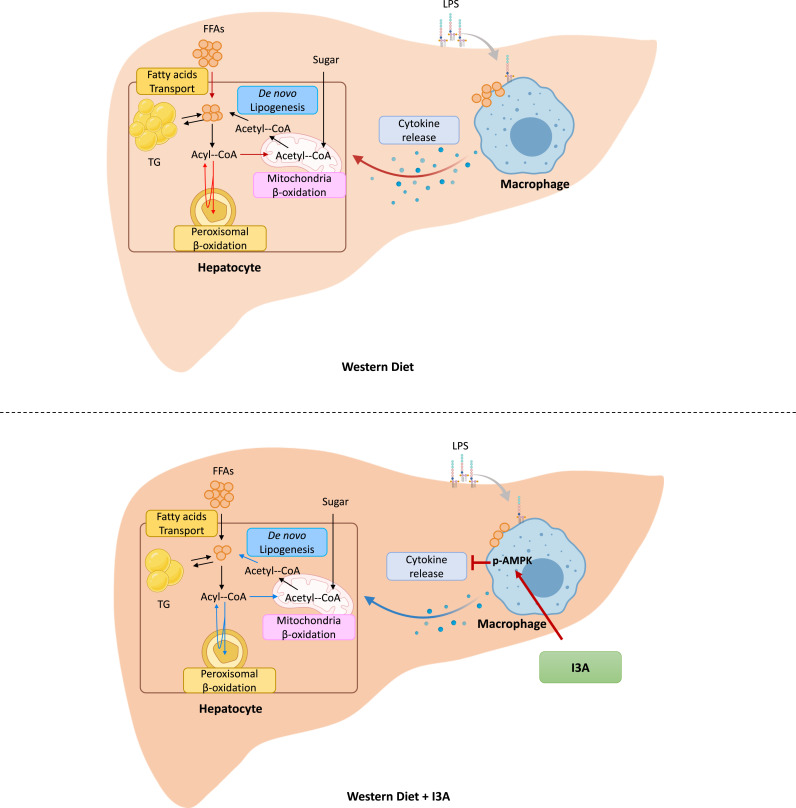
Figure 6—figure supplement 3. When mice are fed with a Western diet (WD) (top panel), triglycerides (TG) and free fatty acids (FFAs) accumulate in the liver due to increased uptake of fatty acids.

Figure 6—figure supplement 3.

This also leads to increased β-oxidation in the mitochondria and peroxisomes. In liver macrophages, the increase in FFAs, possibly in conjunction with circulating endotoxins (e.g. LPS), stimulates production of inflammatory cytokines. When mice fed the WD are treated with indole-3-acetate (I3A) (bottom panel), both TG and FFAs decrease in the liver. Rather than impact fatty acid uptake, I3A treatment reduces de novo lipogenesis through a downregulation of fatty acid synthase (Fasn), while also reducing both mitochondrial and peroxisomal β-oxidation. In macrophages, I3A attenuates fatty acid and LPS-stimulated production of inflammatory cytokines through activation of AMP-activated protein kinase (AMPK).