. 2024 Feb 28;12:RP87989. doi: 10.7554/eLife.87989

Figure 1. Structure of human SIRT6 in complex with the nucleosome.

(a) Front (top) and side (bottom) views of a composite cryo-EM reconstruction of human SIRT6-nucleosome. Maps from focused refinements of SIRT6 (magenta – Rossmann fold and Zn-finger domains labelled) and the nucleosome (H2A – yellow; H2B – orange; H3 – blue; H4 – green; DNA – light and dim grey). (b) Corresponding views of the atomic model of the complex.

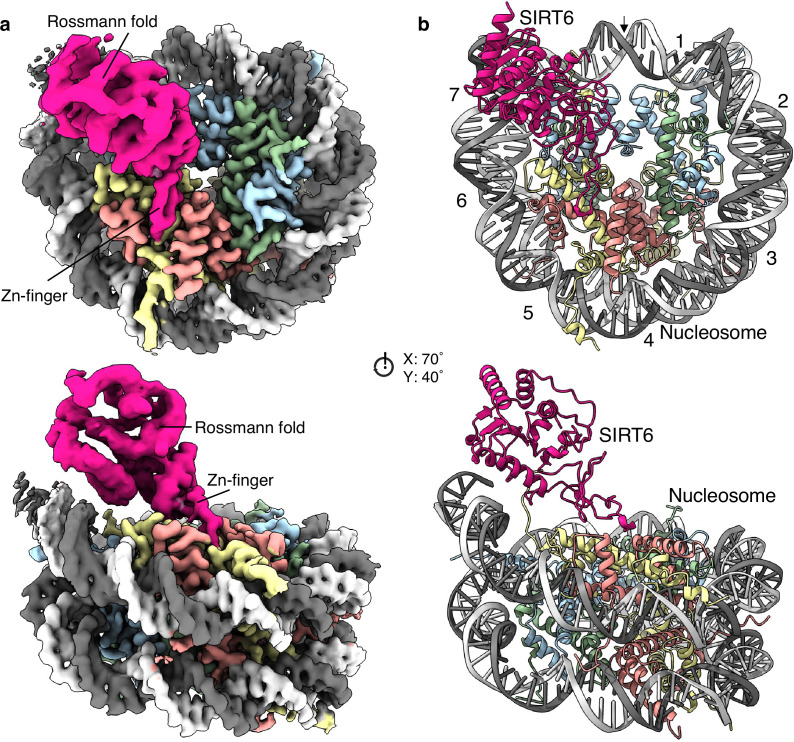
Figure 1.

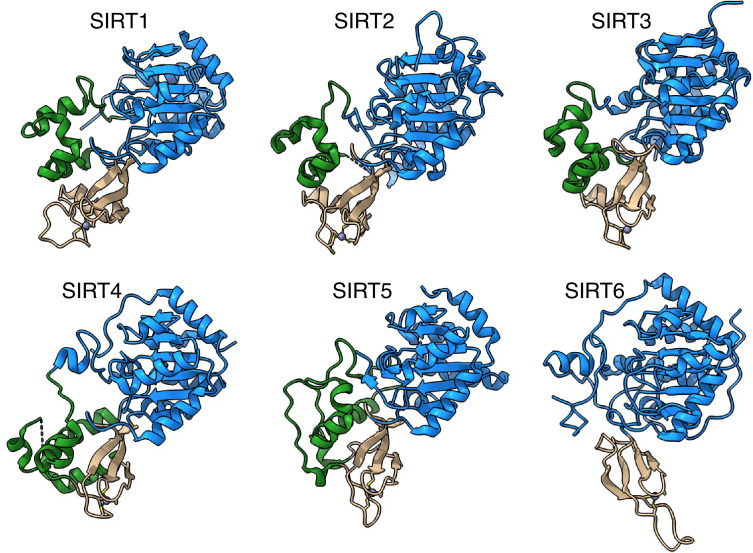
Figure 1—figure supplement 1. SIRT6 lacks the helix bundle between the Rossmann fold and the Zinc-finger domains.

Figure 1—figure supplement 1.

The structures of human sirtuins are depicted – the Rossmann fold domain in blue, Zinc-finger in tan and the helix bundle between the two in green.
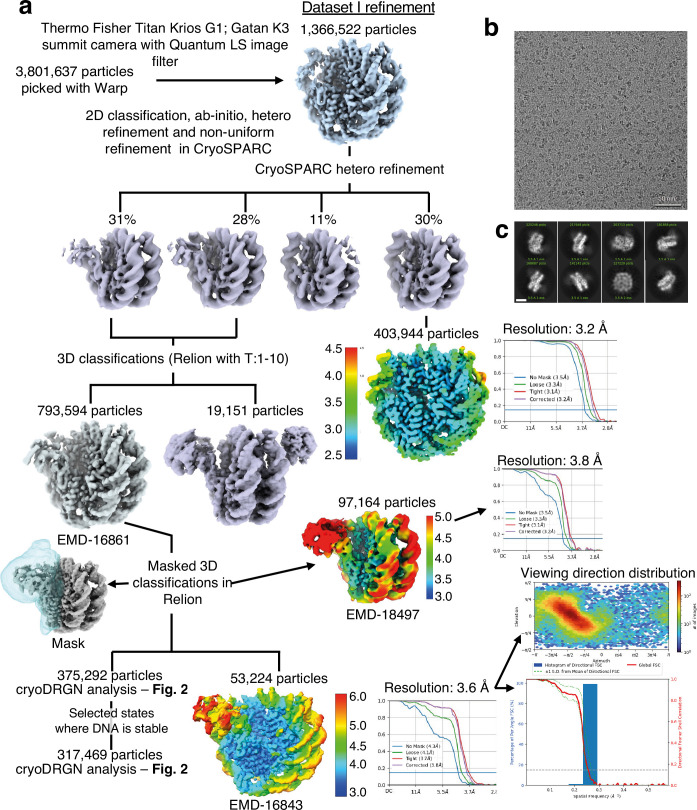
Figure 1—figure supplement 2. Cryo-EM data analysis strategy for SIRT6-nucleosome – dataset 1.

Figure 1—figure supplement 2.

(a) Complete data processing scheme. Maps colored in rainbow represent the local resolution of the reconstructions. Hollow blue volume represents the mask used for focused classification and refinement. FSC curves are depicted as a function of resolution in angstrom. CryoSPARC v.3 and v.4 were used to generate the 3.6 Å overall resolution map of SIRT6-nucleosome complex. RELION 3 was used for classifications of flexible regions, corresponding to the Rossmann fold domain of SIRT6. (b) Original micrograph of SIRT6-nucleosome complex. (c) Two-dimensional class averages showing high-resolution structural features.
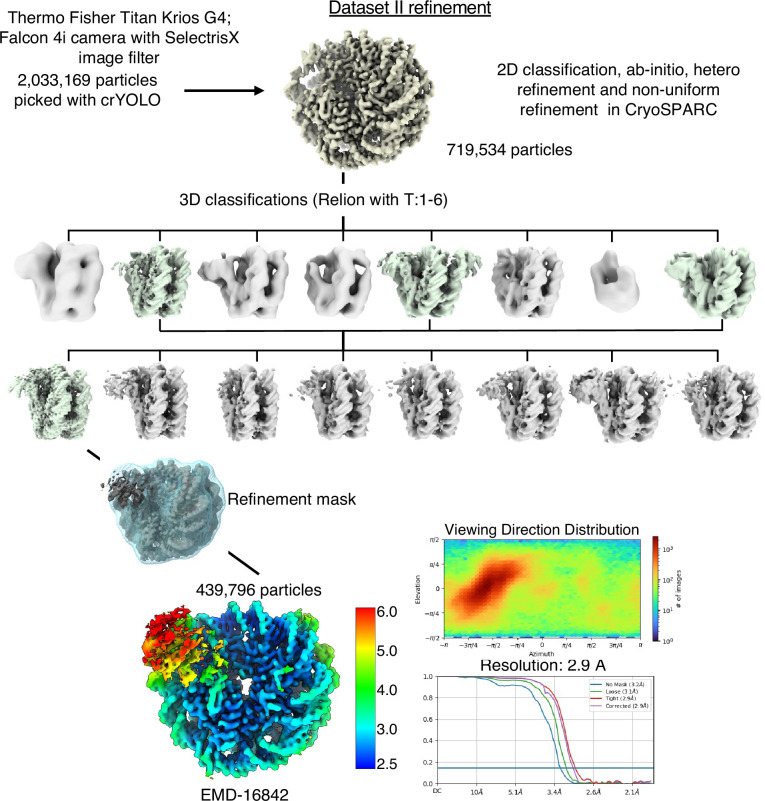
Figure 1—figure supplement 3. Cryo-EM data analysis strategy for SIRT6-nucleosome – dataset 2.

Figure 1—figure supplement 3.

Complete data processing scheme. Maps colored in rainbow represent the local resolution of the reconstructions. FSC curves are depicted as a function of resolution in angstrom. CryoSPARC v.3 and v.4 and Relion 3 were used for 3D classification and to generate the 2.9 Å overall resolution map of SIRT6-nucleosome complex.
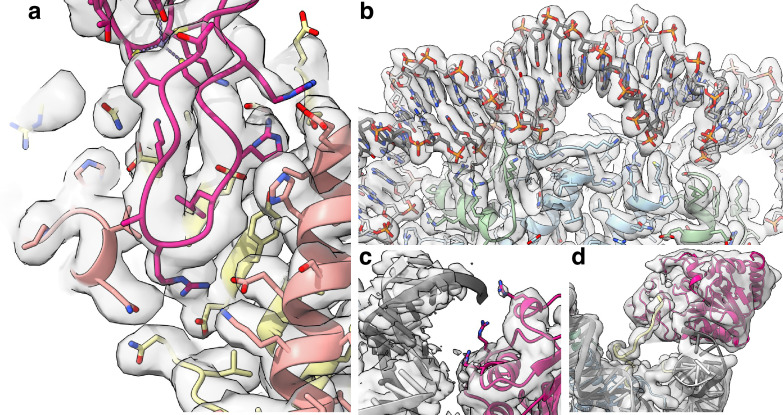
Figure 1—figure supplement 4. Representative regions illustrating the quality of the cryo-EM map of SIRT6 bound to nucleosome.

Figure 1—figure supplement 4.

(a) Close-up view of the SIRT6 Zn-finger interacting with the nucleosomal acidic patch. (b) View showing map details around the nucleosome dyad. (c) SIRT6 Rossmann fold domain interaction with the DNA. (d) Density used to trace H2A tail.
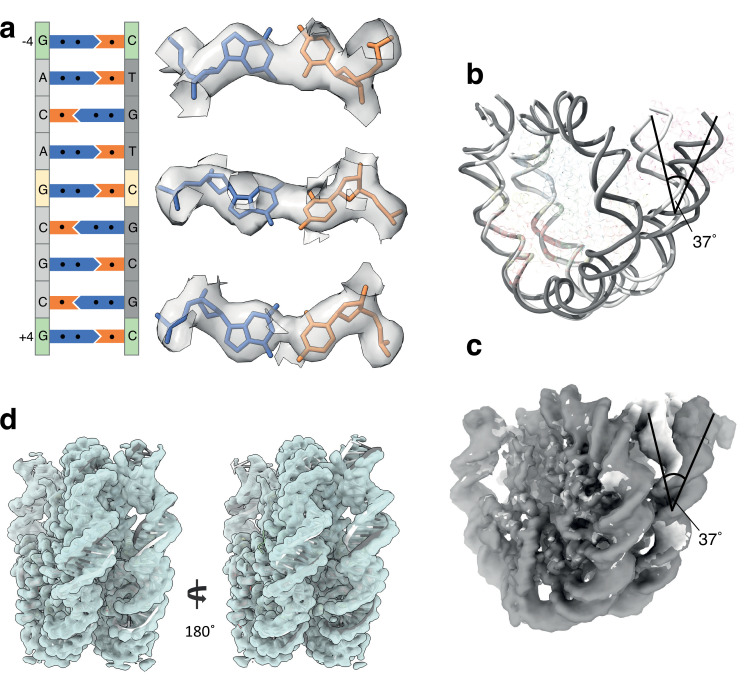
Figure 1—figure supplement 5. SIRT6 binds to and displaces the “looser” DNA terminus.

Figure 1—figure supplement 5.

(a) Cryo-EM densities of the nucleotide base pairs at the dyad (yellow) and positions ± 4 (green) showing the orientation of the DNA in the SIRT6-nucleosome complex. Besides the dyad, the positions ± 4 are also asymmetric in the nucleosome with the Widom-601 DNA. (b) The binding of SIRT6 to the nucleosome alters the path of the terminus DNA by 37°. Nucleosomal DNA is compared with (dim grey) and without (white) bound SIRT6. (c) The same views as in panel b with the cryo-EM maps. (d) Nucleosome without SIRT6 has no deviation of the DNA termini. PDB 3LZ0 was fitted to the nucleosome structure.