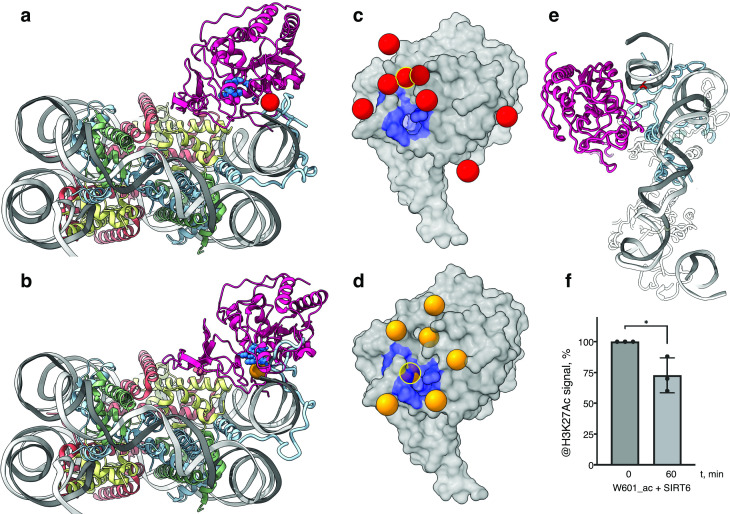
Figure 4. SIRT6 poised to deacetylate lysine residues of H3.
(a) Side View of SIRT6 bound to the nucleosome with histone H3 K9 residue (red sphere) closest to the SIRT6 active site (blue spheres) from a set of molecular dynamics simulations. (b) Side View of SIRT6 bound to the nucleosome with histone H3 K18 residue (orange sphere) closest to the SIRT6 active site from a set of molecular dynamics simulations. (c) All H3K9 positions (red spheres) in close proximity (<15 Å) to the SIRT6 active site (blue) taken from a set of 15 molecular dynamics simulations and depicted on the surface view of SIRT6 bound to nucleosome. (d) All H3K18 positions (orange spheres) in close proximity (<15 Å) to the SIRT6 active site (blue) taken from a set of 15 molecular dynamics simulations and depicted on the surface view of SIRT6 bound to nucleosome. (e) Molecular dynamics simulations show that H3 c-terminal tail (blue) can protrude toward SIRT6 in a space formed between the histone octamer and the DNA. H3K27 is shown in red. (f) Quantification analysis of H3K27ac bands intensities in deacetylation assay. Bars show percentage of signal detected in western blot run with anti-H3K27ac antibodies. Bars represent mean ± SD of three biological replicates (shown as dots). * indicates a statistically significant difference between the 0 min (control) and 60 min (SIRT6 treatment) fraction of acetylated H3K27 (p=0.0396 in one-way paired t-test).

