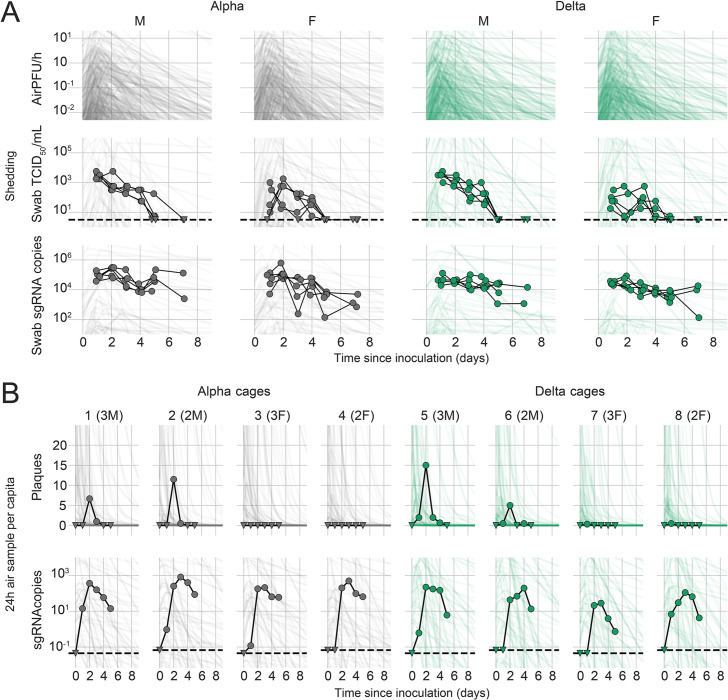
Appendix 1—figure 1. Prior predictive checks.
Figure is as main text Figure 1, except that the trajectories showed by the semi-transparent lines are randomly sampled from the prior predictive distribution rather than from the posterior, and 500 lines are drawn in panel A rather than 100, given the greater dispersion relative to the data. Wide range of simulated trajectories relative to the data shows that priors allow for a wide range of a priori plausible kinetics.

