. 2024 Feb 28;12:RP87094. doi: 10.7554/eLife.87094

Figure 1. Alpha and Delta variant shedding profiles in oral swabs and air samples.

Syrian hamsters were inoculated with 103 TCID50 via the intranasal route with Alpha or Delta. ( A) Comparison of swab viral load and virus shedding into the air. Inferred profile of air shedding in PFU/h compared to sgRNA levels and infectious virus titers (TCID50/mL) in oropharyngeal swabs collected 1, 2, 3, 4, 5, and 7 DPI. Semitransparent lines are 100 random draws from the inferred posterior distribution of hamster within-host kinetics for each of the metrics. Joined points are individual measured timeseries for experimentally infected hamsters; each set of joined points is one individual. Measurements and inferences shown grouped by variant and animal sex. Measurement points are randomly jittered slightly along the x (time) axis to avoid overplotting. (B). Viral sgRNA and infectious virus (PFU) recovered from cage air sample filters over a 24 hr period starting at 0, 1, 2, 3, 4, and 5 DPI. Points are measured values, normalized by the number of hamsters in the cage (2 or 3) to give per-capita values. Downward-pointing arrows represent virus below the limit of detection (0 observed plaques or estimated copy number corresponding to Ct ≥40). Semitransparent lines are posterior predictions for the sample that would have been collected if sampling started at that timepoint; these reflect the inferred underlying concentrations of sgRNA and infectious virus in the cage air at each timepoint and are calculated from the inferred infection kinetics for each of the hamsters housed within the cage. 100 random posterior draws shown for each cage. Cages housed 2 or 3 hamsters; all hamsters within a cage were of the same sex and infected with the same variant. Column titles show cage number and variant, with number of and sex of individuals in parentheses. Dotted lines limit of detection. Grey = Alpha, teal = Delta, p-values are indicated where significant. Abbreviations: sg, subgenomic; TCID, Tissue Culture Infectious Dose; PFU, plaque forming unit; F, female; M, male; DPI, days post inoculation.

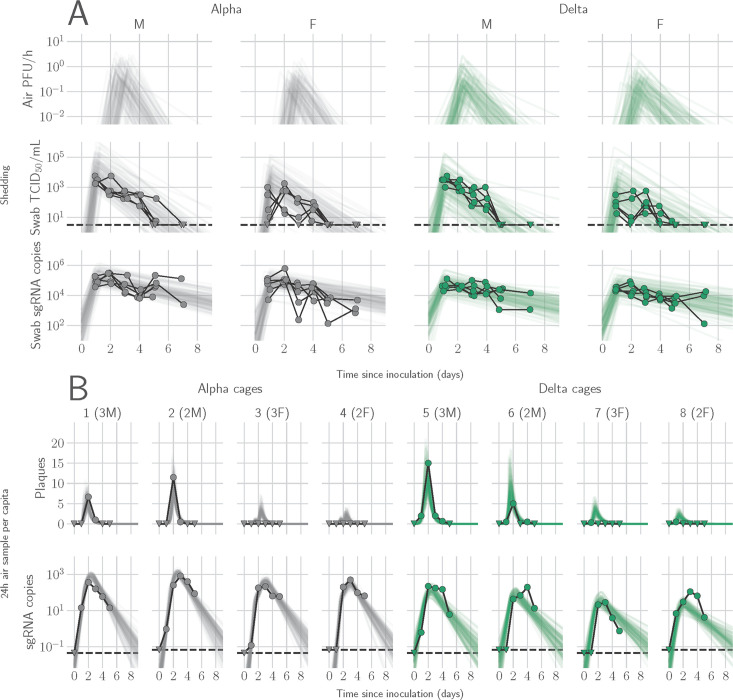
Figure 1.

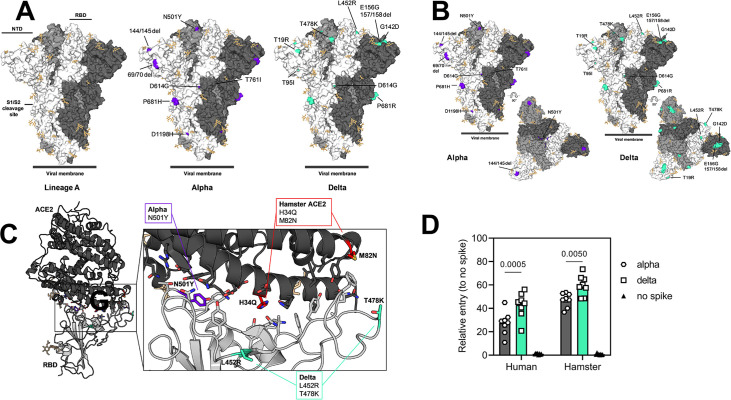
Figure 1—figure supplement 1. Alpha and Delta variant spike interaction with hamster ACE2.

Figure 1—figure supplement 1.

(A, B) Mutations observed in the SARS-CoV-2 Alpha and Delta VOCs are highlighted on the structure of SARS-CoV-2 spike (PDB 6ZGE, Wrobel et al., 2020). The spike trimer is depicted by surface representation with each protomer colored a different shade of gray. The residues at the positions of the spike protein mutations observed in the Alpha and Delta SARS-CoV-2 VOCs are colored purple (Alpha) and teal green (Delta) and annotated. N-linked glycans are shown as light, orange-colored sticks. (C) The structure of the Alpha VOC RBD and human ACE2 complex (PDB 7EKF Han et al., 2021) is depicted with cartoon representation. ACE2 is colored dark gray and the RBD is colored light gray. N-linked glycans are shown as light, orange-colored sticks. A box reveals a close-up view of the RBD-ACE2 binding interface. Side chains of the residues participating in the interaction, as identified and described by Lan, et al. (Smith et al., 2004) are shown as sticks. The residues within the RBD that are mutated in the Alpha and Delta VOCs are colored purple (Alpha, N501Y) and teal green (Delta, L452R and T478K). Although they do not participate directly in the ACE2 interface, the sidechains of residues L452 and T478 are also shown. The residues that differ between human and hamster ACE2 within the interface are colored red. (D) BHK cells expressing either human ACE2 or hamster ACE2 were infected with pseudotyped VSV reporter particles with the spike proteins of Alpha or Delta. Relative entry to no spike control is depicted. Bar-chart depicting median, 95% CI and individuals, N=8, ordinary two-way ANOVA, followed by Šídák’s multiple comparisons test. Abbreviations: RBD, receptor binding domain; ACE2, Angiotensin-converting enzyme 2; VOCs, variants of concern.
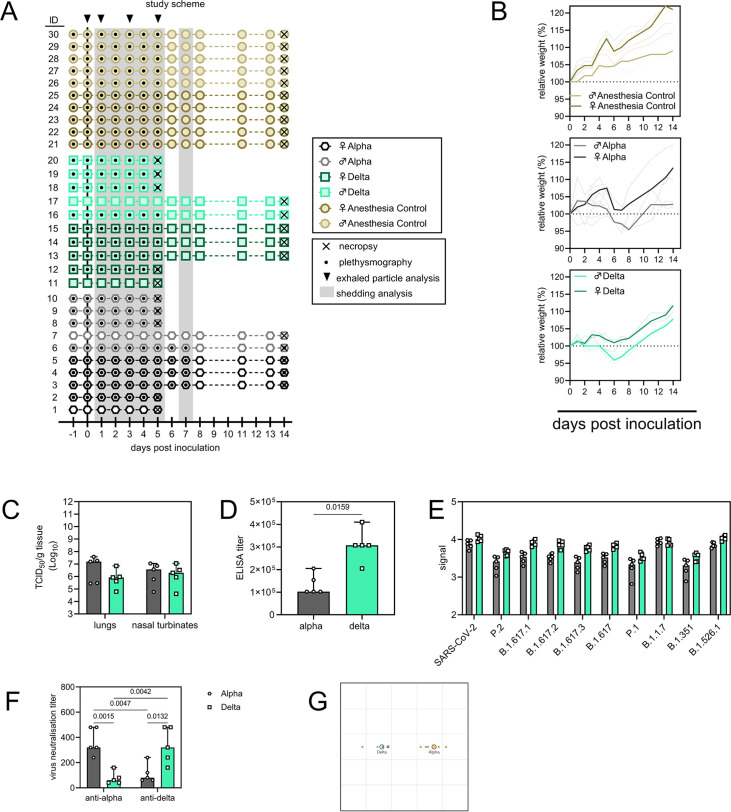
Figure 1—figure supplement 2. Schematic overview of inoculation experiment.

Figure 1—figure supplement 2.

(A) Four-to-6-week-old female and male Syrian hamsters (ENVIGO) were inoculated (N=10 per virus, N=5 per sex) with 103 TCID50 intranasally (IN) with either SARS-CoV-2 Alpha or Delta variants, or no virus (anaesthesia controls). At 5 days post inoculation, five hamsters for each group were euthanized, and tissues were collected. The remaining five animals for each route were euthanized at 14 DPI for disease course assessment and shedding analysis. For the control group no day 5 necropsy was performed. Schematic indicates when oropharyngeal swabs were collected, when whole body plethysmography was performed, when air sampling was conducted and when exhaled particle profiles were determined. (B) Relative weight loss. Graph shows median (thick line) and individuals, colors indicate sex. (C). Viral load as measured by infectious titers in lungs and nasal turbinates collected at day 5 post inoculation. Bar-chart depicting median, 96% CI and individuals, N=5, ordinary two-way ANOVA, followed by Šídák’s multiple comparisons test. (D) Binding antibodies against spike protein of SARS-CoV-2 in serum obtained 14 days post inoculation. Bar-chart depicting median, 96% CI and individuals, N=5, Mann-Whitney test. ELISA was performed once. (E) Binding antibodies against spike protein of various variants of concern analyzed by MesoPlex. Bar-chart depicting median, 96% CI and individuals, N=5 ordinary two-way ANOVA, followed by Šídák’s multiple comparisons test. Assay was performed once. (F) Virus neutralization titers against Alpha and Delta, depicted as reciprocal titers. N=5, ordinary two-way ANOVA, followed by Tukey’s multiple comparisons test. Assay was performed once. Grey = Alpha, teal = Delta, beige = anesthesia control. (G) Antigenic map (Smith et al., 2004) depicting the cross-reactivity based on neutralization. The spacing between grid lines is 1 unit of antigenic distance, corresponding to a twofold dilution of serum in the neutralization assay. The resulting antigenic distance is depicted between Alpha and Delta. p-Values are indicated where significant. Abbreviations: ELISA, Enzyme-linked immune-absorbent Assay.
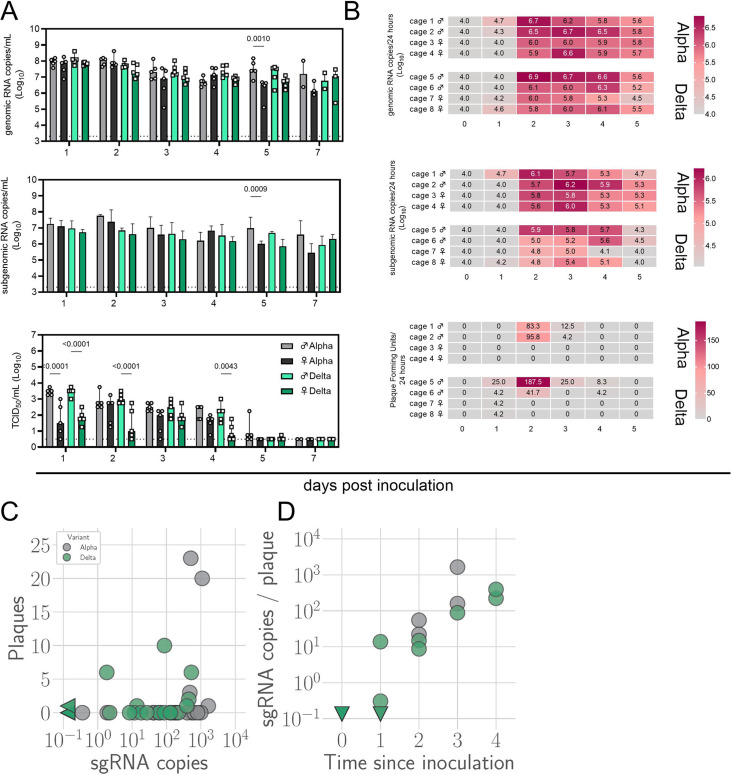
Figure 1—figure supplement 3. Window of Alpha and Delta variant shedding profiles.

Figure 1—figure supplement 3.

Syrian hamsters were inoculated with 103 TCID50 via the intranasal route with Alpha or Delta. (A) Viral load as measured by gRNA, sgRNA and infectious titers in oropharyngeal swabs collected at days 1, 2, 3, 4, 5, and 7 post inoculation. Bar-chart depicting median, 96% CI and individuals, N=5, ordinary two-way ANOVA, followed by Šídák’s multiple comparisons test. Dotted line = limit of detection. Grey = Alpha, teal = Delta, dark = female, light = males (B) Virus isolated from cage air over 24 hr intervals, measured as gRNA, sgRNA and plaque forming units on days 0, 1, 2, 3, 4, and 5. The column marked 1 corresponds to samples taken from 0 to 24 hr post inoculation. Each cage housed two or three hamsters. Heatmap depicting individual cages across each day, colors referring to legends on the right. RNA: limit of detection = 4.0, Plaque forming units: limit of detection = 0. (C) sgRNA sampled from air versus infectious virus sampled from air. Point color indicates variant: Alpha (grey) or Delta (teal). Sampled sgRNA copies value versus sampled plaques. (D) Number of estimated sgRNA copies per plaque in samples as a function of day sampled and variant. p-values are indicated where significant. Abbreviations: g, genomic; sg, subgenomic; TCID, Tissue Culture Infectious Dose.