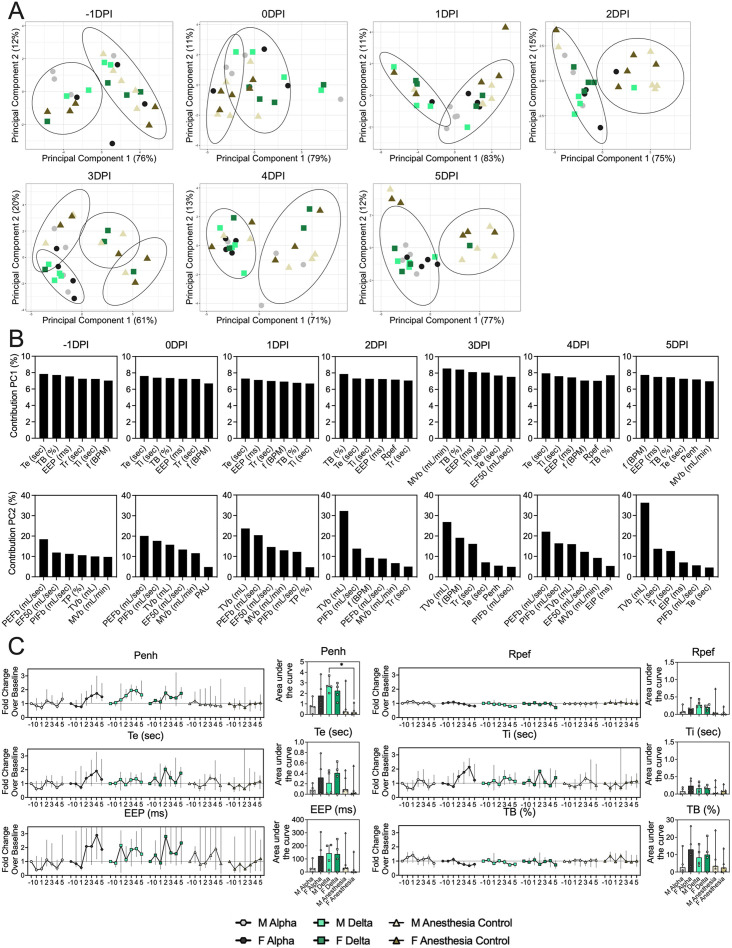
Figure 2. Lung function and breathing changes after SARS-CoV-2 infection with Alpha and Delta.
Syrian hamsters were inoculated with 103 TCID50 via the intranasal route with Alpha or Delta. (A) Lung function was assessed on days –1, 0, 1, 2, 3, 4, and 5 by whole body plethysmography. Principal component analysis was used to investigate individual variance. Depicted are principal component (PC) 1 and 2 for each day, showing individual animals (colors refer to legend on right, sex-separated) and clusters (black ellipses). (B) Individual loading plots for contributions of top 6 variables to PC1 and 2 at each day. (C) Relevant subset of lung function parameters. Line graphs depicting median and 95% CI fold change values (left) and area under the curve (AUC, right), Kruskal-Wallis test, p-values indicated where significant. Grey = Alpha, teal = Delta, beige = anesthesia control, light = male, dark = female. Abbreviations: Expiratory time (Te), inspiratory time (Ti), percentage of breath occupied by the transition from inspiration to expiration (TB), end expiratory pause (EEP), breathing frequency (f), peak inspiratory flow (PIFb), peak expiratory flow (PEFb), tidal volume (TVb), minute volume (MVb), enhanced pause (Penh), male (M), female (F).


