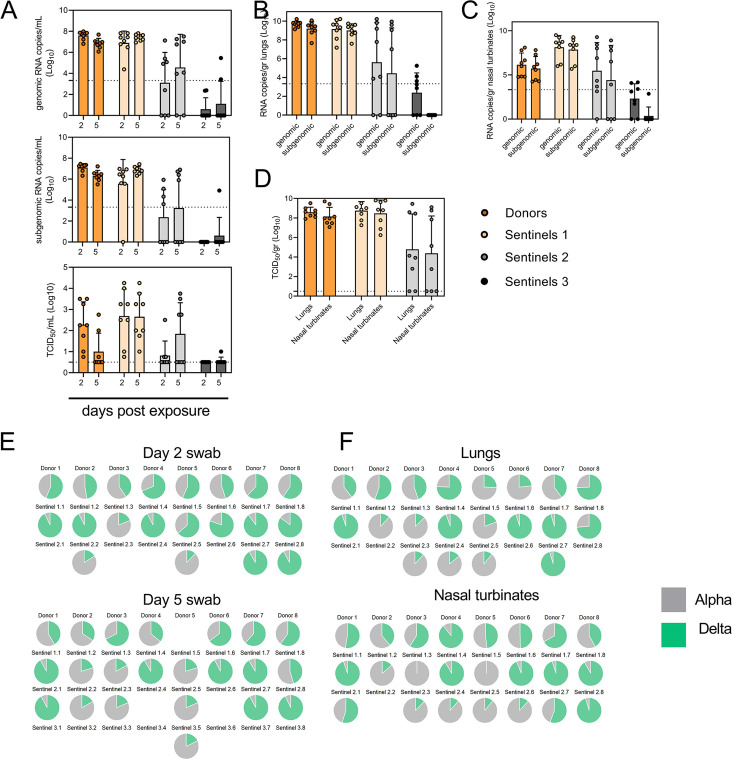
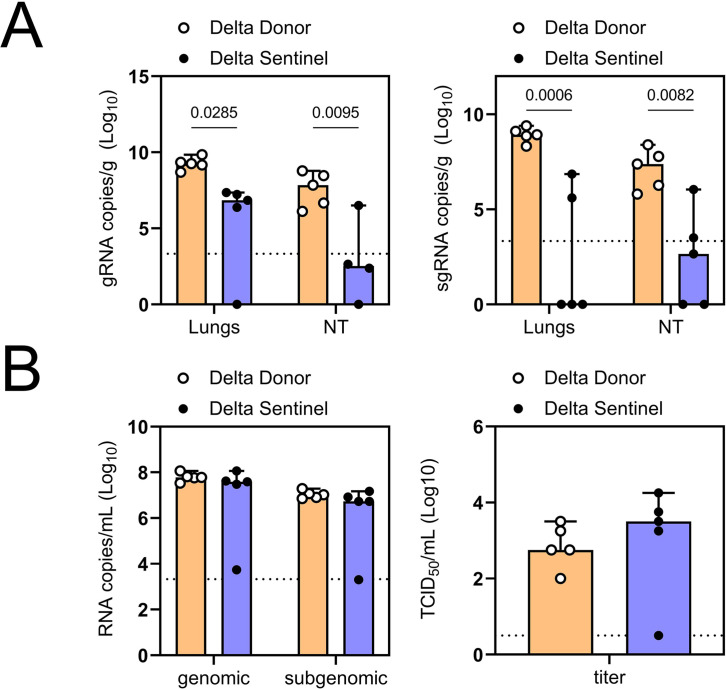
Figure 5. Airborne competitiveness of Alpha and Delta SARS-CoV-2 variants.
(A) Schematic. Donor animals (N=8) were inoculated with Alpha and Delta variant with 5x10² TCID50, respectively, via the intranasal route (1:1 ratio), and three groups of sentinels (Sentinels 1, 2, and 3) were exposed subsequently at a 16.5 cm distance. Animals were exposed at a 1:1 ratio; exposure occurred on day 1 (Donors → Sentinels 1) and day 2 (Sentinels → Sentinels). (B) Respiratory shedding measured by viral load in oropharyngeal swabs; measured by gRNA, sgRNA, and infectious titers on days 2 and day 5 post exposure. Bar-chart depicting median, 96% CI and individuals, N=8, ordinary two-way ANOVA followed by Šídák’s multiple comparisons test. (C-E). Corresponding gRNA, sgRNA, and infectious virus in lungs and nasal turbinates sampled five days post exposure. Bar-chart depicting median, 96% CI and individuals, N=8, ordinary two-way ANOVA, followed by Šídák’s multiple comparisons test. Dark orange = Donors, light orange = Sentinels 1, grey = Sentinels 2, dark grey = Sentinels 3, p-values indicated where significant. Dotted line = limit of detection. (F) Percentage of Alpha and Delta detected in oropharyngeal swabs taken at days 2 and day 5 post exposure for each individual donor and sentinel, determined by deep sequencing. Pie-charts depict individual animals. Grey = Alpha, teal = Delta. (G) Lung and nasal turbinate samples collected on day 5 post inoculation/exposure. (H). Summary of data of variant composition, violin plots depicting median and quantiles for each chain link (left) and for each set of samples collected (right). Shading indicates majority of variant (grey = Alpha, teal = Delta). (I) Correlation plot depicting spearman r for each chain link (right, day 2 swab) and for each set of samples collected across all animals (left). Colors refer to legend on right. Abbreviations: TCID, Tissue Culture Infectious Dose.


