. 2024 Feb 26;12:RP89371. doi: 10.7554/eLife.89371

Figure 2. DNA methylation-environment interactions reveal methylation-dependent responses to IFNA and dexamethasone challenge.

(A) Full mSTARR-seq design across DNA methylation and challenge conditions (see Figure 2—figure supplements 1 and 2 for filtering and overlap of the datasets, and Supplementary files 3, 10 and 11 for effect sizes). An example of a DNA methylation-environment interaction is shown overlapping the interferon-induced gene IFIT5 and an ENCODE-annotated weak promoter (pink denotes weak promoter, yellow denotes heterochromatin, and green denotes weak transcription; the endogenous IFIT5 gene expression response to IFNA in our experiment is shown in Figure 2—figure supplement 4). Three consecutive 600 bp windows have interaction FDR <1 x 10⁻⁴ in this region. Panels depict non-normalized, raw read pileups for mSTARR-seq RNA replicates, with all y-axis maximums set to 14,000. No methylation-dependent activity is detectable in the baseline condition because this enhancer element is inactive. Upon IFNA stimulation, only unmethylated enhancer elements are capable of responding. (B) Upset plot showing shared and unique mSTARR-seq identified enhancer elements across conditions. While many elements are shared, 3426 are unique to a single condition (FET log-odds results for magnitude of overlap are shown in Figure 2—figure supplement 3). (C) Top five most enriched transcription factor binding motifs in IFNA- and dex-specific mSTARR-seq enhancers, compared to all windows tested. Whiskers show the 95% CI. See Supplementary files 12 and 13 for all enrichment results. (D) Genes targeted by ISRE enhancers (ISRE enhancers identified from ENCODE ChIP-seq data; gene targets identified from enhancer-gene linkages from EnhancerAtlas 2.0: Gao et al., 2016) that are also identified as IFNA condition-specific mSTARR-seq enhancers (n=119) show stronger K562 endogenous gene expression responses to IFNA stimulation than non-ISRE targets (n=10557; unpaired t-test: t=3.58, df = 118.36, p=5.01 x 10⁻⁴; Supplementary file 16). Each box represents the interquartile range, with the median value depicted as a horizontal bar. Whiskers extend to the most extreme values within 1.5 x of the interquartile range. (E) mSTARR-seq regulatory activity for windows containing ISRE targets (n=1,005 windows) interacts strongly with exposure to IFNA. These windows are capable of mounting a strong response to IFNA stimulation when unmethylated (dashed line; paired t-test: t=23.02, df = 1004, p=1.78 x 10–94) but not when methylated (solid line; paired t-test: t=–1.74, df = 1004, p=0.082). Dots show the mean beta corresponding to enrichment of RNA reads versus DNA reads across windows; whiskers show the standard error. Because y-axis values correspond to model estimates, they can be positive (i.e. more mSTARR-seq RNA reads than input DNA reads) or negative values (i.e. fewer mSTARR-seq RNA reads than mSTARR-Seq input DNA reads, indicating no regulatory activity).

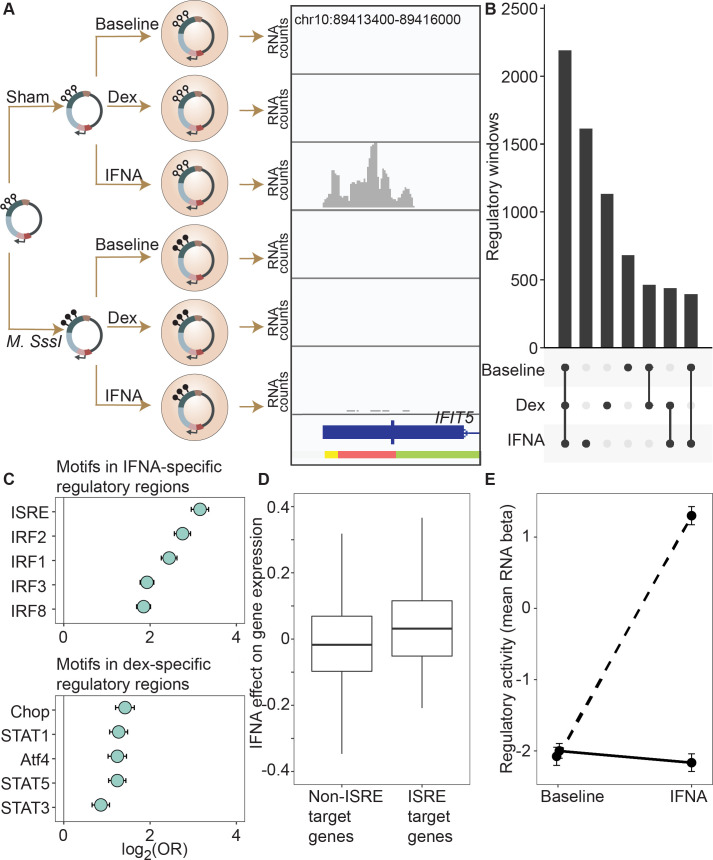
Figure 2.

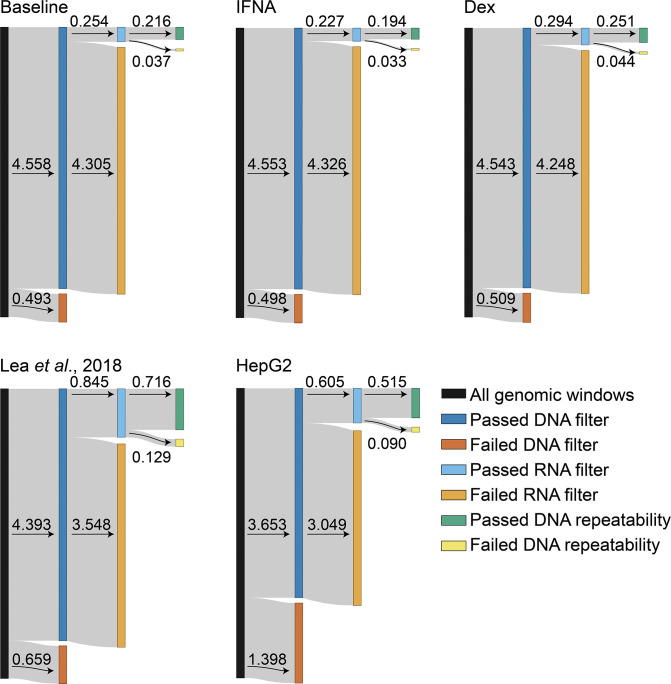
Figure 2—figure supplement 1. Filtering results across datasets.

Figure 2—figure supplement 1.

Each of the five datasets began with 5,051,776 600 bp genomic windows. For each of the five datasets, we reduced the dataset to windows that had nonzero counts in at least three DNA samples in the methylated condition and three DNA samples in the unmethylated condition (i.e. 6 DNA samples total; ‘DNA filter’). We then reduced the dataset to windows that had nonzero counts in at least three RNA samples in either the methylated or unmethylated condition (‘RNA filter’). Finally, we retained only windows that showed high repeatability across DNA samples, following Lea et al., 2018 (‘DNA repeatability’). Numbers correspond to million windows that passed or failed each filter for which the arrow points to. Note that one mSTARR RNA-seq sample in the baseline condition [sample ID L31250] was removed from further analysis because it had an unusually high proportion of zero counts in the testable windows; we therefore also removed the corresponding paired DNA sample prior to analysis. See Supplementary file 9 for the precise window numbers corresponding to the plots.
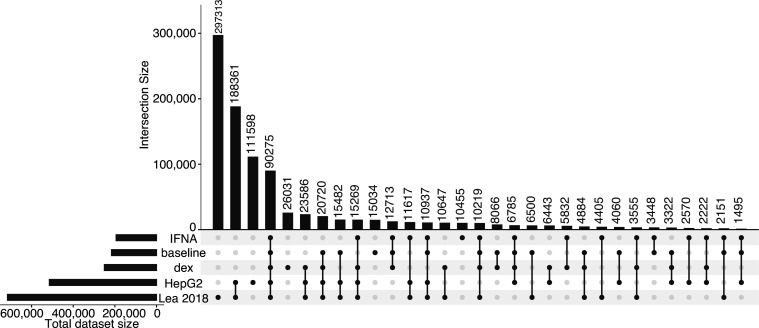
Figure 2—figure supplement 2. Overlap of tested genomic windows across datasets.

Figure 2—figure supplement 2.

Upset plots showing the degree to which 600 bp non-overlapping genomic windows are shared between five datasets (baseline null, IFNA, dex, HepG2, and Lea et al., 2018; all datasets were analyzed following the same pipeline). Note that the same input library was used in Lea et al., 2018 and the HepG2 experiment, which differs from the library used here for baseline, dex, and IFNA experiments.
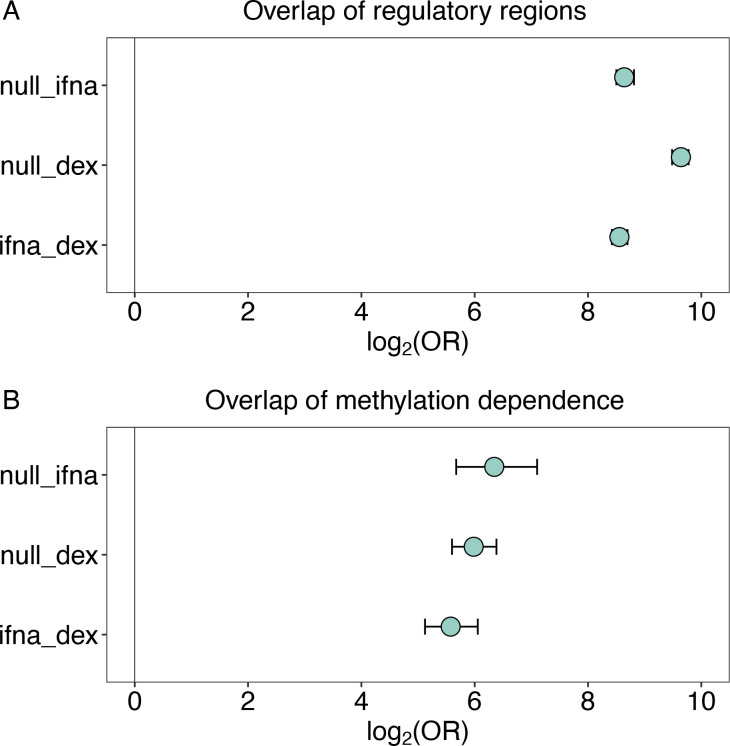
Figure 2—figure supplement 3. Overlap of regulatory activity and effects of methylation across environmental conditions.

Figure 2—figure supplement 3.

(A) Regulatory regions in the baseline condition are highly likely to retain regulatory activity upon challenge with IFNA or dex (IFNA log2(OR) [95% CI]=8.639 [8.499, 8.812], p<1.0 x 10–300; dex log2(OR) [95% CI]=9.640 [9.483, 9.776], p<1.0 x 10–300). Regulatory regions also significantly overlap between IFNA- and dex-challenged cells (log2(OR) [95% CI]=8.554 [8.420, 8.698], p<1.0 x 10–300). (B) Regulatory windows identified in two environmental conditions tend to share significant effects of DNA methylation on regulatory activity (i.e. interaction effects between methylation and regulatory activity) across the two environmental conditions (baseline and IFNA log2(OR) [95% CI]=6.345 [5.673, 7.102], p<7.33 x 10–239; baseline and dex log2(OR) [95% CI]=5.982 [5.599, 6.384], p<1.0 x 10–300; IFNA and dex log2(OR) [95% CI]=5.576 [5.123, 6.055], p<4.70 x 10–266). Whiskers show the 95% CI.
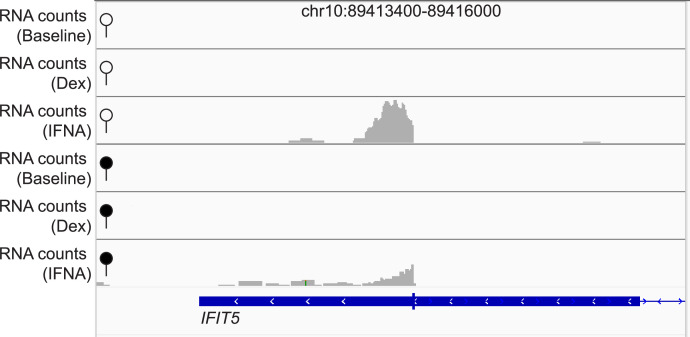
Figure 2—figure supplement 4. IFIT5 endogenous gene expression is responsive to IFNA stimulation.

Figure 2—figure supplement 4.

Tracks show non-normalized, raw read pile-ups of endogenous IFIT5 (ENSG00000152778) gene expression in either the unmethylated (open circle) or methylated (filled circle) condition, with all y-axis maximums set to 100. The replicates for endogenous gene expression shown here are the same replicates used for measuring regulatory activity shown in Figure 2A. IFIT5 is only detectably expressed after IFNA stimulation (note that the difference in peak heights between the IFNA-stimulated unmethylated and methylated conditions is because the plot shows raw reads; there is no effect of methylation treatment on endogenous IFIT5 gene expression after normalization for library size: P=0.489).