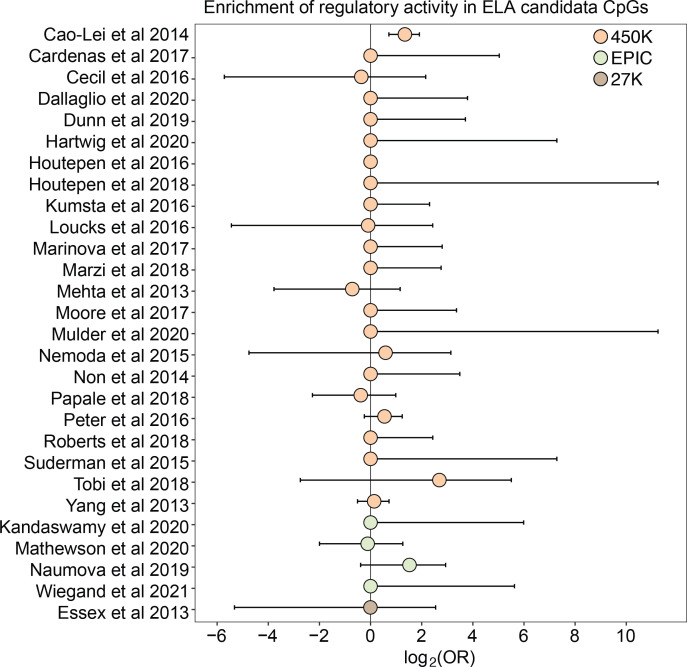
Figure 4. Early life adversity-associated CpG sites are not enriched for mSTARR-seq regulatory activity.
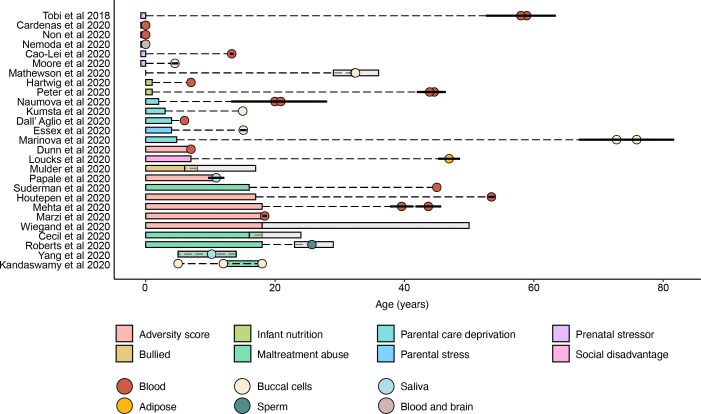
Log2-tranformed odds ratios from Fisher’s Exact Tests for enrichment relative to the background set of sites on each array platform, for 27 studies of early life adversity-DNA methylation level correlations (see Supplementary file 20 for full FET results). Whiskers show standard error. Only Cao-Lei et al., 2014 shows significant enrichment for regulatory activity (log2(OR) [95% CI]=1.343 [0.715, 1.909], p=3.39 x 10⁻⁵), but these sites are not more likely to exhibit methylation-dependent activity than expected by chance (log2(OR) [95% CI]=0.884 [-0.338, 2.130], p=0.16). For details on the source tissue and measures of ELA, see Figure 4—figure supplement 1.


