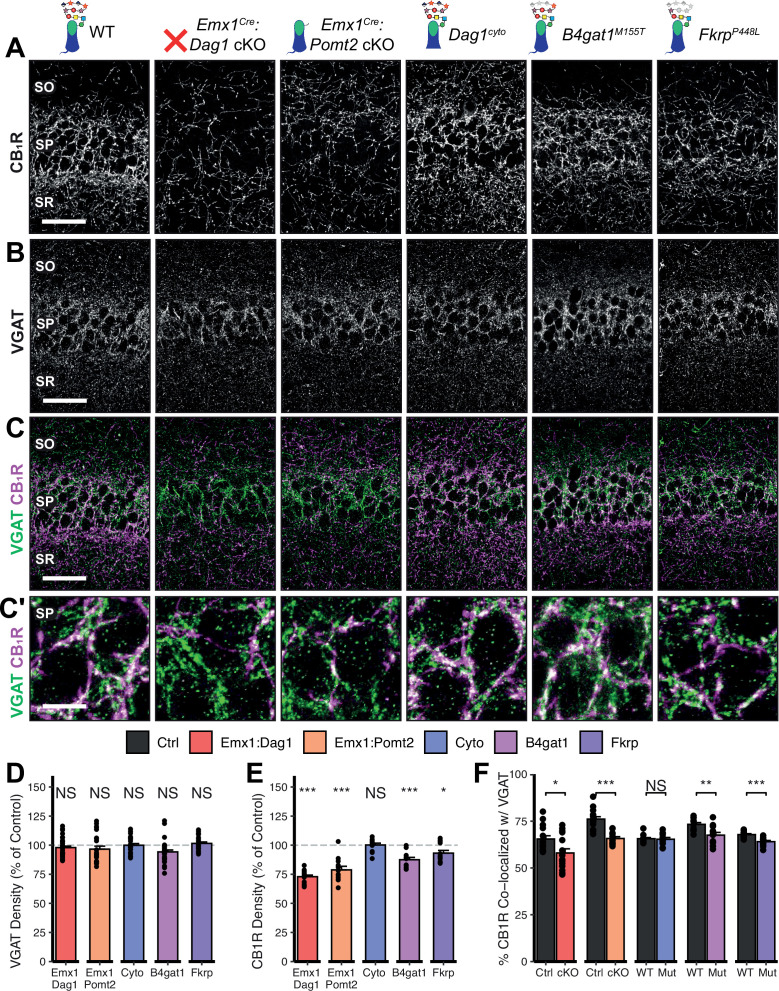
Figure 5. Dag1 and Pomt2 cKOs exhibit impaired CB1R+ basket synapse formation in stratum pyramidale of hippocampal CA1.
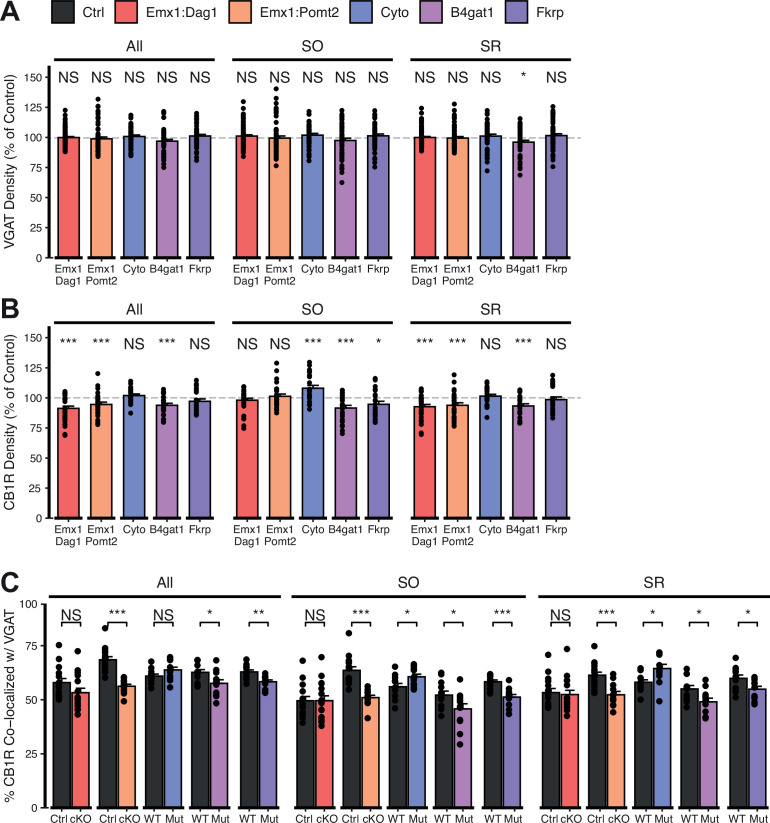
P30 coronal sections immunostained for (A) CB1R and (B) VGAT in hippocampal CA1; merged image in (C) shows CB1R in magenta and VGAT in green. (A–C) Scale bar = 50 μm. (Higher magnification view of SP in (C’); scale bar = 10 μm.) (D) Quantification of VGAT puncta density in SP expressed as a percent of control. (E) Quantification of CB1R puncta density in SP expressed as a percent of control. (F) Quantification of co-localization between VGAT and CB1R in SP to estimate putative CB1R+ basket cell synapse formation. Error bars show mean + SEM. (For quantification of puncta densities and co-localization in SO and SR see Figure 5—figure supplement 1.) See Supplementary file 1 for Ns. Significance: *=p < 0.05, **=p < 0.01, ***=p < 0.001, NS = p ≥ 0.05. SO, stratum oriens; SP, stratum pyramidale; SR, stratum radiatum.


