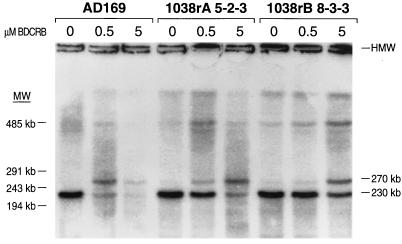
FIG. 5.
Analysis of HCMV DNA maturation by CHEF electrophoresis. The band visualized at the top of the gel (labelled HMW) is DNA which did not leave the loading well. The 230-kb bands at the bottom of the gel migrate at the position expected for viral DNA molecules of monomer genome size, based on lambda genome concatemeric molecular size markers (MW) loaded on the same gel.

