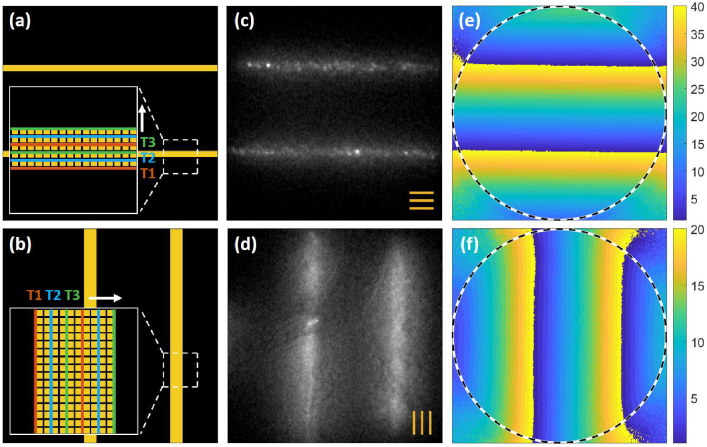
Fig. 1.
Schematic of multi-line patterns of (a) horizontal line illumination for photoreceptor imaging and (b) the vertical direction for retinal vascular imaging. Illumination lines are shown in yellow. The insets show enlarged illumination lines that are scanned vertically and horizontally with the step size of one and two mirror elements, respectively, over time T1 (orange), T2 (blue) and T3 (green). Examples of single sub-frames of (c) photoreceptors and (d) retinal vasculature. The orange lines indicate the orientation of the line illumination. The spatial masks used for composite image reconstruction of (e) photoreceptor and (f) retinal vasculature images. Each pixel is assigned to a number between 1 and the number of complementary patterns (20 for vasculature and 40 for photoreceptors), as shown on the color scale [20]. Dotted circles indicate the illumination area.

