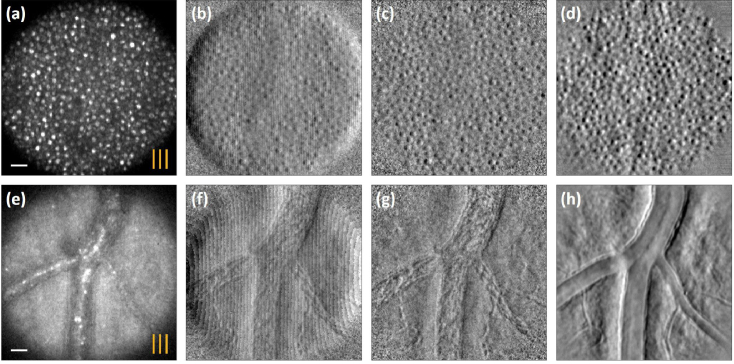
Fig. 3.
Single composite confocal images of (a) photoreceptors of N1 at TR and (e) retinal vasculature at T SR obtained under vertical line illumination. Corresponding phase contrast images (b) and (f) showing the periodic variation and (c) and (g) after dividing by the unregistered average. (d) and (h) are the corresponding registered average images from (c) and (g). The scale bar is 20 m.

