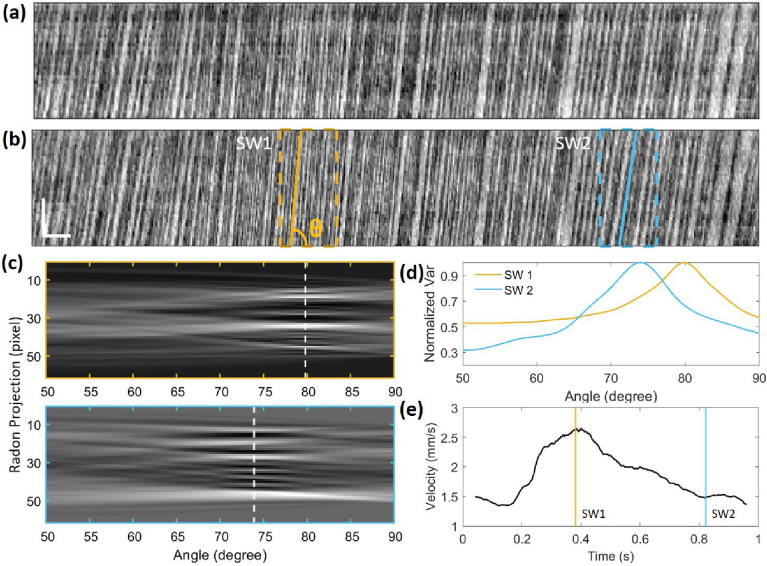
Fig. 4.
Kymographs of a capillary of N1 at T SR (a) before and (b) after reduction of temporal and spatial non-uniformities. Two sampling windows (SW1 and SW2) and corresponding tilted trace angles are shown as colored dotted boxes and tilted lines, respectively. The horizontal scale bar is 40 ms, and the vertical scale bar is 10 m. (c) Radon projections of SW1 and SW2 with dotted lines representing the trace angles. (d) The normalized variance of the Radon projections as a function of angle for SW1 and SW2. (e) Measured blood flow velocities from (b) with solid lines indicating velocities in SW1 and SW2.

