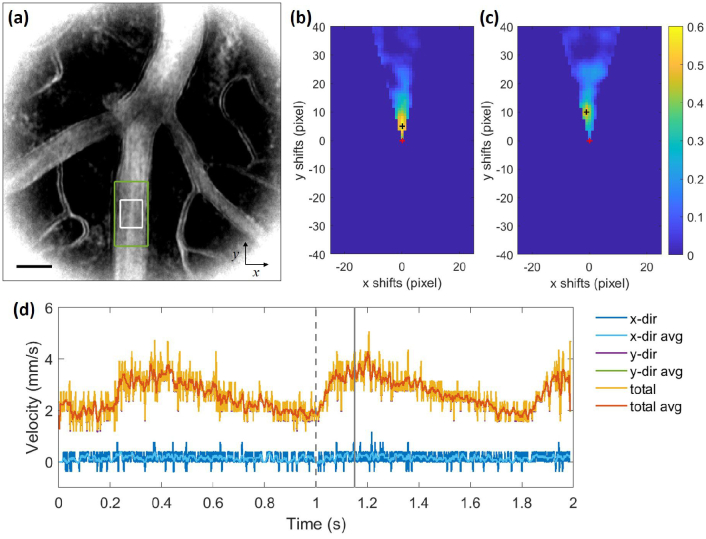
Fig. 5.
(a) Motion contrast image obtained from the phase contrast images of N1 at T SR. Rectangular boxes (green and white) indicate ROIs for the velocity calculation. The scale bar is 30 m. Cross-correlation maps within their spatial offset search region at the (b) minimum and (c) maximum velocity. The red and black crosses indicate the origin and local maximum chosen for spatial offset, respectively. (d) Measured blood flow velocity with dotted and solid gray vertical lines indicating the minimum and maximum velocities from (b) and (c), respectively. The blood flow velocities in x- (blue), y- (orange) and flow (yellow) direction (root mean square of velocities in x- and y-direction) and corresponding averaged velocities (light blue, green, red) over time (10 ms, 5 frames) are shown. Note that the horizontal component of velocities is close to zero as the vessel is oriented vertically.

