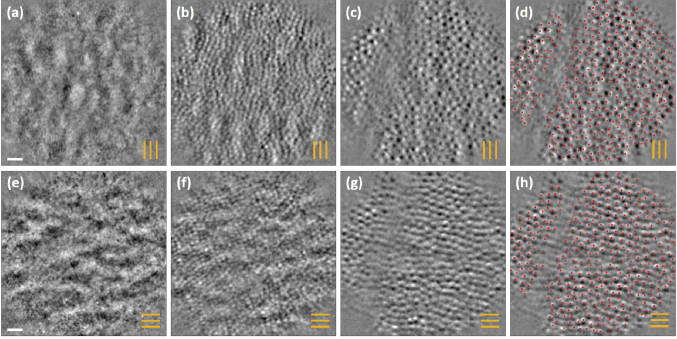
Fig. 7.
Phase contrast images corresponding to Fig. 6 under (a)-(c) vertical line illumination and (e)-(g) horizontal line illumination. The orange lines indicate the orientation of the line illumination. (d) and (h) show the TR images from (c) and (g) with the 360 cone centers marked with red spots for direct comparison also compared to Fig. 6(d) and (h). The scale bar is 20 m.

