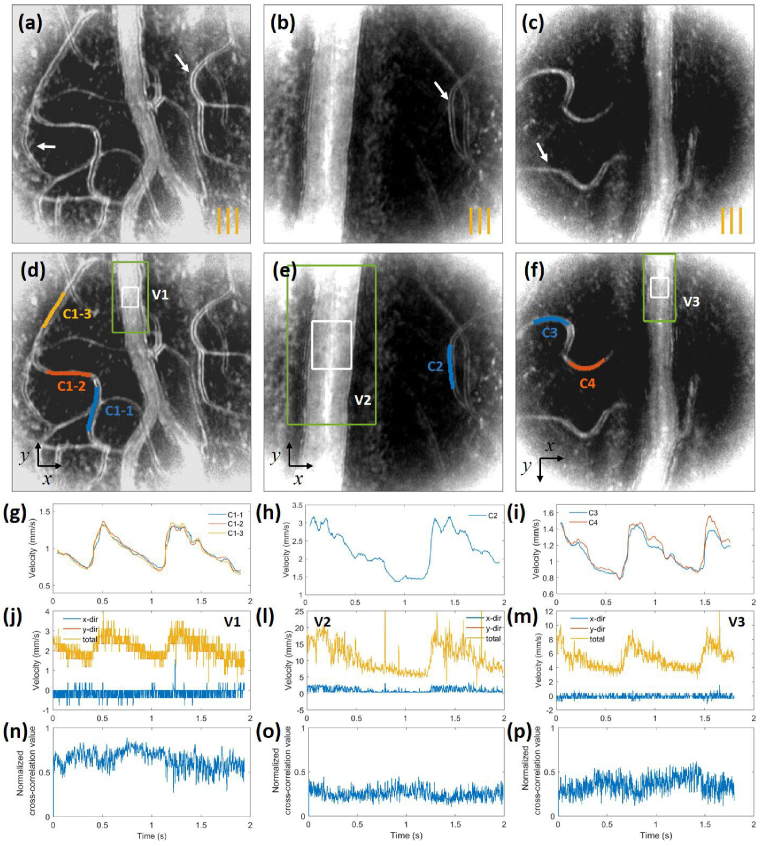
Fig. 9.
(a)-(c) Motion contrast images calculated from the same set of images as shown in Fig. 8(d)-(f), respectively. Arrows indicate capillaries not readily observed in Fig. 8. The orange lines indicate the orientation of the line illumination. (d)-(f) Duplicated motion contrast images with ROIs indicated by lines and rectangular boxes. (g)-(i) Measured blood flow velocities in capillaries and (j)-(m) arterioles or venules. (n)-(p) Normalized cross-correlation values corresponding to the velocities of (j)-(m), respectively.

