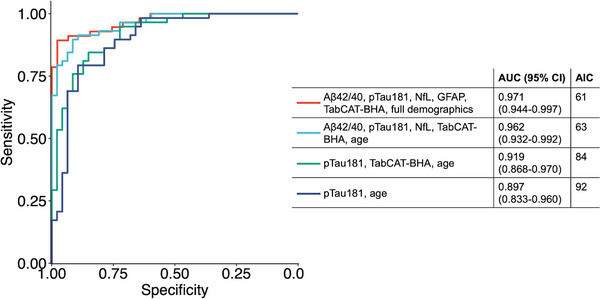
FIGURE 1.

Comparative performance of models combining plasma biomarkers, TabCAT‐BHA, and demographic and clinical covariates in discriminating Aβ‐PET status. ROC curves are based on logistic regression models in 105 participants (47 Aβ‐PET negative, 58 Aβ‐PET positive). Full model (red) included all markers and demographic variables (age, sex, education, presence of APOE 𝜀4 allele, and time difference between PET acquisition and plasma collection) as predictors. Optimal model (teal) offered the best fit with lowest number of predictors. Aβ‐PET, amyloid β positron emission tomography; AIC, Akaike information criterion; APOE, apolipoprotein E; AUC, area under the ROC curve; CI, confidence interval; ROC, receiver operating characteristic; TabCAT‐BHA, Tablet‐based Cognitive Assessment Tool Brain Health Assessment.
