. 2024 Jan 5;12:RP90133. doi: 10.7554/eLife.90133

Figure 3. Bsh suppresses L1/L3 neuronal fate.

(A–E) Bsh-knockdown (KD) in lamina progenitor cells (LPCs) results in the ectopic expression of the L1 marker Svp and L3 marker Erm in L4/L5 cell body layers (circled). (C) Schematic of lamina neuron development from 1-day pupae to adult. (D and E) Quantification of Erm and Svp expression. Here and below, scale bar, 10 µm. (F–H) Bsh-KD in LPCs does not produce ectopic Bab2-positive neurons or glia in the L5 layer (circled). n≥5 brains. Genotype: R27G05-Gal4>UAS-Bsh-RNAi. (H) Quantification of Bab2 expression. (I–L) Bsh-KD in LPCs results in ectopic Svp+ L1 neurons at the expense of Pdm3+ L5 neurons. Bsh GFP+ neurons marked with yellow arrowheads show L1 marker Svp expression in Bsh-KD while L5 marker Pdm3 expression is in control. Genotype: Bsh-LexA>LexAop-GFP. (K and L) Quantification of Pdm3 and Svp expression. (M–O) Bsh-KD transforms L5 neuron morphology to L1-like neuronal morphology. (M) Control L5 neurons have very few dendrites in the lamina neuropil. Genotype: R27G05-Gal4, Bsh-LexA>LexAop-GFP. (N) Bsh-KD transforms L5 neuron morphology to L1-like neuronal morphology. Genotype: R27G05-Gal4>UAS-Bsh-RNAi; Bsh-LexA>LexAop-GFP. (O) Control L1 neurons show bushy dendrites throughout the lamina. Genotype: svp-Gal4, R27G05-FLP>UAS-FRT-stop-FRT-myrGFP. (P) Summary. Data are presented as mean ± SEM. Each dot represents each brain. n=5 brains in (D), (E), (H), (K), and (L). *p<0.05, **p<0.01, ***p<0.001, ns = not significant, unpaired t-test.

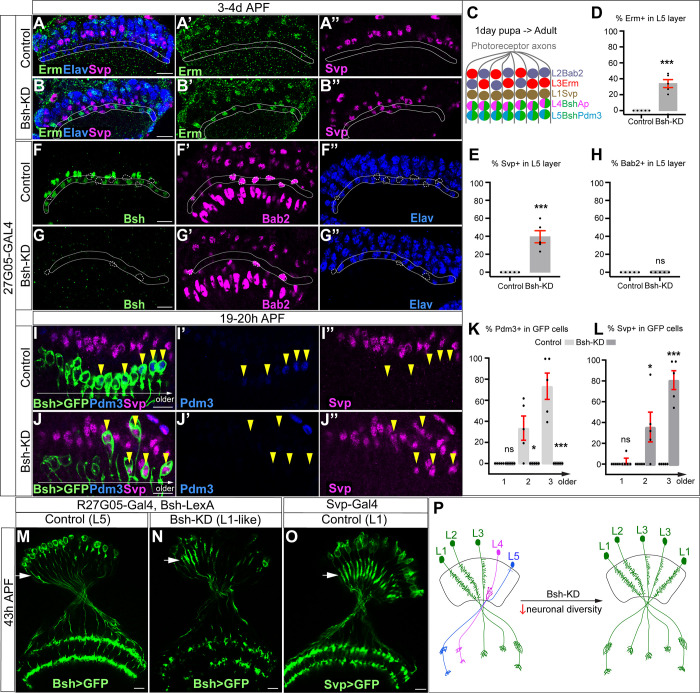
Figure 3.

Figure 3—figure supplement 1. Loss of Bsh in lamina progenitor cells (LPCs) transforms L5 neurons into L1 neurons.

Figure 3—figure supplement 1.

(A–A’’) Bsh-LexA drives LexAop-myrGFP expression in L5 neurons but not L4 at 20 hr after pupa formation (APF). Older GFP cell bodies express L5 marker Pdm3. Ap labels L4 neurons. The white circle outlines GFP+ cells. Scale bar, 10 µm.
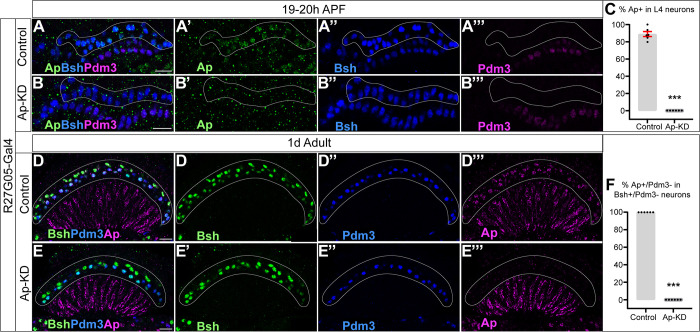
Figure 3—figure supplement 2. Ap-knockdown (KD) eliminates Ap initiation and maintenance in L4 neurons.

Figure 3—figure supplement 2.

(A–C) Ap initiation in L4 neurons is eliminated at 19–20 hr after pupa formation (APF) when knocking down Ap (27G05-GAL4>UAS-Ap-RNAi). The top Bsh+ labels L4 and the bottom Bsh+ labels L5. Ap and Pdm3 are expressed in older L4 and older L5 neurons, respectively. The Ap expression in L5 neurons is caused by the Gal4 driver line but is irrelevant here. Scale bar, 10 µm. (C) The percentage of Ap expression in L4 neurons (top Bsh+ row) in control (A) and Ap-KD (B). (D–F) Ap expression remains undetectable in adults though Bsh expression remains normal. Bsh is unlikely able to reinitiate Ap expression if normal Ap initiation is lost. Scale bar, 10 µm. (F) The percentage of Ap expression (Ap+/Pdm3-) in L4 neurons (Bsh+/Pdm3-) in control (D) and Ap-KD (E). Data are presented as mean ± SEM. Each dot represents each brain. n=6 brains in (C) and (F). ***p<0.001, unpaired t-test.
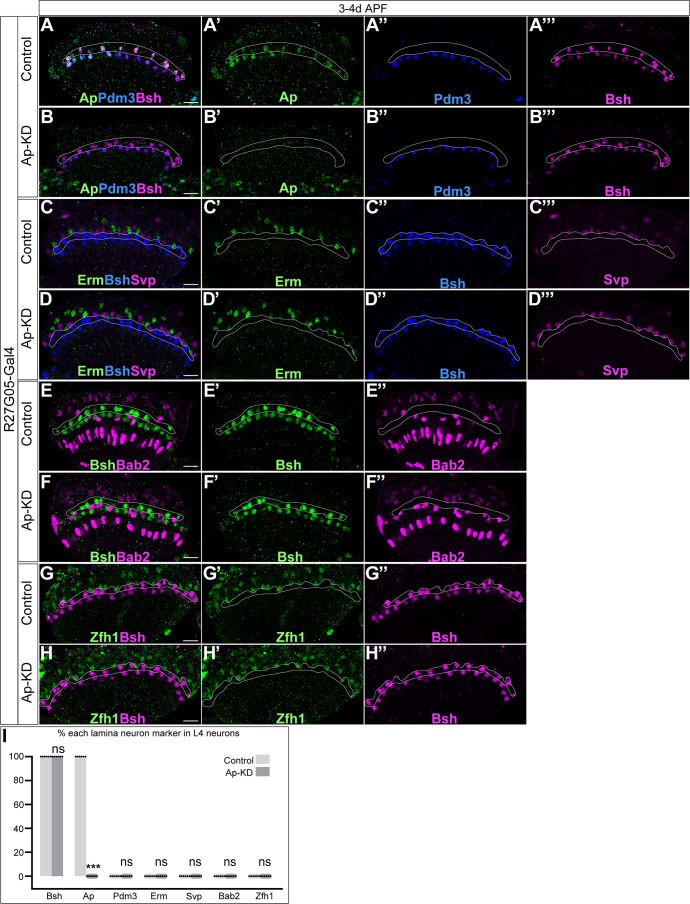
Figure 3—figure supplement 3. Ap is not required to suppress other lamina neuron markers in L4 neurons.

Figure 3—figure supplement 3.

(A–H’’) L1 (Svp, Zfh1), L2 (Bab2), L3 (Erm, Zfh1), and L5 (Pdm3) markers are not expressed in L4 neurons (top Bsh+ row) at 3–4 days after pupa formation (APF) when knocking down Ap (27G05-GAL4>UAS-Ap-RNAi). Scale bar, 10 µm. (I) The percentage of each lamina neuron marker in L4 neurons (top row of Bsh+). ***p<0.001, ns = not significant, unpaired t-test, n=6 brains, each dot represents each brain, data are presented as mean ± SEM.