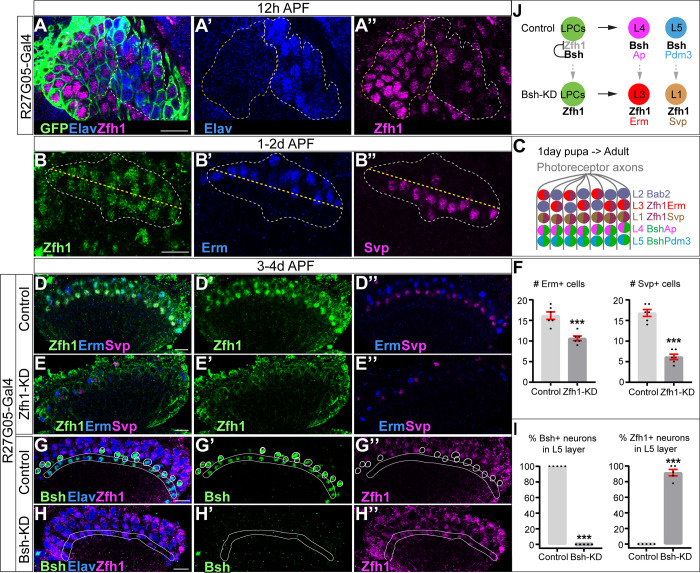
Figure 4. Bsh represses Zfh1 to suppress L1/L3 neuronal fate.
(A–A’’) Zfh1 is expressed in all lamina progenitor cells (LPCs) and some lamina neurons at 12 hr after pupa formation (APF). GFP labels all lamina cells. Elav labels lamina neurons. The yellow dash circle outlines LPCs and the white dash circle outlines lamina neurons. Genotype: R27G05-Gal4>UAS-myrGFP. Here and below, scale bar, 10 µm. n≥5 brains. (B–B’’) Zfh1 is expressed in Svp+ L1 and Erm+ L3 neurons at 1–2 days APF; Svp and Erm are never co-expressed. The white dashed circle outlines L1 and L3 neurons and the yellow line indicates the rough boundary between L1 and L3 cell bodies. (C) Schematic of lamina neuron development from 1-day pupae to adult. (D–F) Zfh1-knockdown (KD) in LPCs results in a loss of Svp+ L1 and Erm+ L3 neurons. Quantification: the number of Erm+ or Svp+ cell bodies in a single optical slice. Genotype: R27G05-Gal4>UAS-zfh1-RNAi. (G–I) Bsh-KD in LPCs results in ectopic Zfh1 in L4/L5 layers. White circles label Bsh+ cell bodies in L4 layer in control. L5 layer, white outline. Quantification: the percentage of Bsh+ or Zfh1+ neurons in L5 layer. Genotype: R27G05-Gal4>UAS-bsh-RNAi. (J) Summary. Data are presented as mean ± SEM. Each dot represents each brain. n=6 brains in (F) and n=5 brains in (I). ***p<0.001, unpaired t-test.


