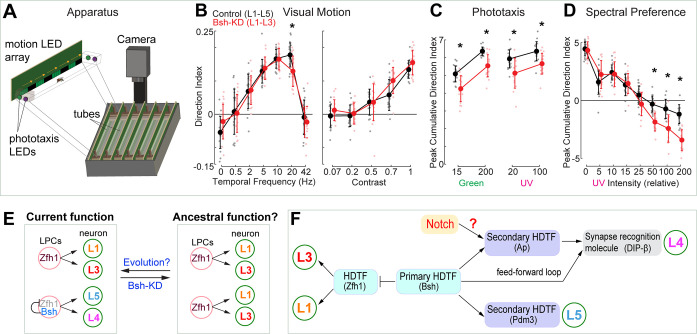
Figure 7. Bsh+ L4/L5 are required for normal visual sensitivity.
(A) Schematic of the Fly Vision Box. (B) Bsh-knockdown (KD) adult flies show reduced responses to a high-speed stimulus. Left: stimulus with different temporal frequency; right: stimulus with 5 Hz temporal frequency, but with the indicated contrast level. (C) Bsh-KD adult flies show reduced phototaxis to both dim and bright lights. Relative intensity was used: 15 and 200 for dim and bright green, respectively; 20 and 100 for dim and bright UV, respectively. (D) Bsh-KD adult flies show larger responses toward bright UV illumination. For lower UV levels, flies walk toward the green LED, but walk toward the UV LED at higher UV levels. Data are presented as mean ± SD, with individual data points representing the mean value of all flies in each tube. For control (mherry-RNAi), n=18 groups of flies (tubes), for Bsh-KD, n=16 groups of flies, run across three different experiments. Each group is 11–13 male flies. *p<0.05, unpaired, two-sample t-test controlled for false discovery rate. (E) Model. Left: In wild type, Zfh1+ lamina progenitor cells (LPCs) give rise to L1 and L3 neurons, whereas Zfh1+Bsh+ LPCs give rise to L4 and L5 neurons. The lineage relationship between these neurons is unknown. Right: Bsh KD results in a transformation of L4/L5 into L1/L3 which may reveal a simpler, ancestral pattern of lamina neurons that contains the core visual system processing arrangement. (F) Summary.


