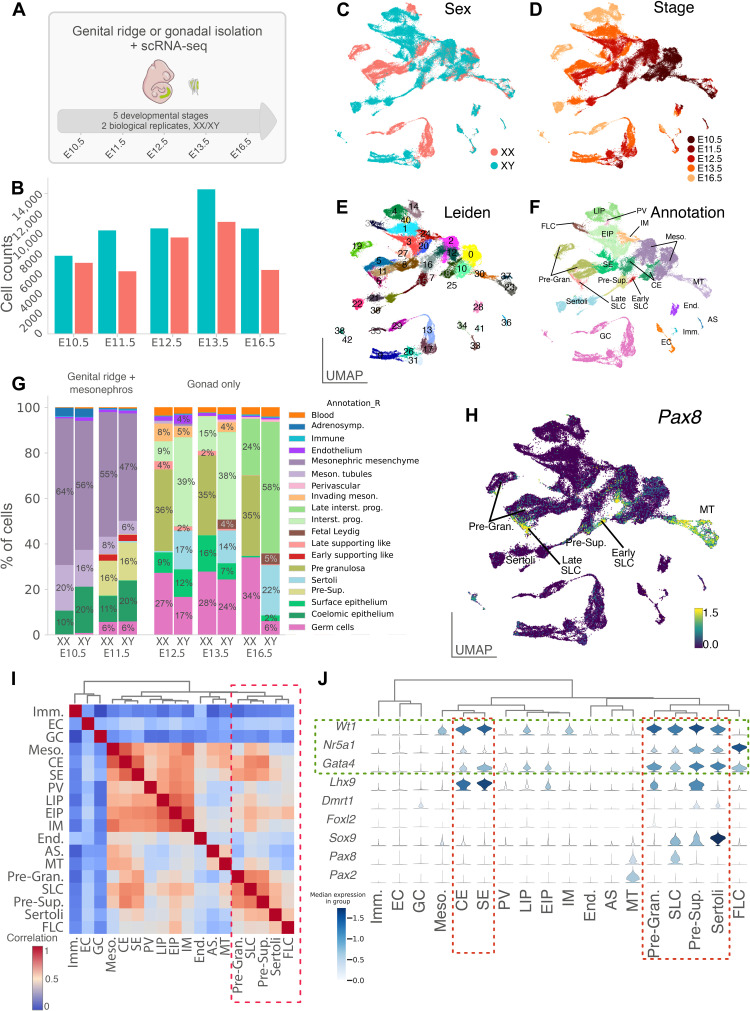
Fig. 1. A single-cell atlas of gonadal development and sex differentiation.
(A) Schematic overview of the experimental procedure and dataset. A representative embryo at E11.5 is shown with (in inset) the region containing the gonads and mesonephros. (B) Barplots show the number of single cells RNA-sequenced per stage and sex. (C to F) UMAP representation of the 94,705 cells colored by sex (C), stage (D), Leiden clustering (E), and annotation of the different cell clusters (F). (G) Proportion of cell types across sex and developmental stages. (H) UMAP representation of the expression level of Pax8 gene. (I) Heatmap showing correlation between transcriptomes of the different cell populations. Populations were ordered using hierarchical clustering based on correlation (Spearman) distance of expression levels between cell populations. (J) Stacked violin plots showing expression (log-normalized counts) of major somatic cell markers of the gonad in annotated cell populations. Populations were ordered as in (I). CE, coelomic epithelial cells; SE, surface epithelial cells; Pre-Sup., presupporting cells; Sertoli, Sertoli cells; Granulosa, pregranulosa cells; EIP, early interstitial progenitors; LIP, late interstitial progenitors; FLC, fetal Leydig cells; IM, invading mesonephric cells; PV, perivascular cells; Imm., immune cells; Meso., mesonephric mesenchymal cells; MT, mesonephric tubules; End., endothelial cells; AS, adrenosympathic cells; GC, germ cells; EC, erythrocytes.

