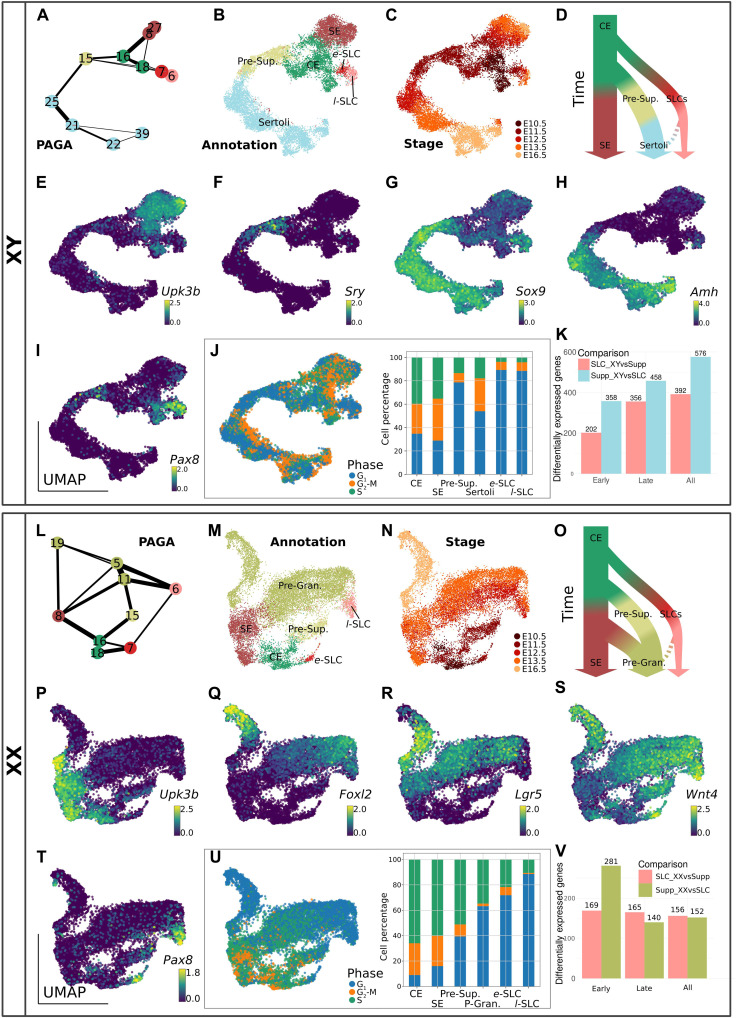
Fig. 2. Characterization of XY and XX SLC populations.
The analysis was performed with both XY (A to K) and XX (L to V) gonadal cells. PAGA representation of the clusters of XY (A) and XX (L) cells expressing Nr5a1, Gata4, and Wt1. Each node is a Leiden cluster, and the links between clusters represent confidence of relation between two clusters. (B, C, M, and N) UMAP projection of gonadal cell lineage at the origin of the supporting cells and SLCs, colored by cell annotation (B and M) and by developmental stage (C and N). Simplified model of the cell lineage reconstruction in the developing testis (D) and ovary (O). UMAP representations of XY (E to I) and XX (P to T) cells colored by expression levels (log-normalized counts) of selected genes. UMAP and barplot representation of the cell cycle phase of XY (J) and XX (U) cells. Barplot illustrates the proportion of cells in the different cell cycle phase for each population. (K and V) Barplots representing the number of DEGs between SLCs and the supporting lineage either in XY (K) or XX (V) developing gonads at early (E11.5) and late (E12.5, E13.5, and E16.5) stages. e-SLC, early SLCs; l-SLC, late SLCs.

