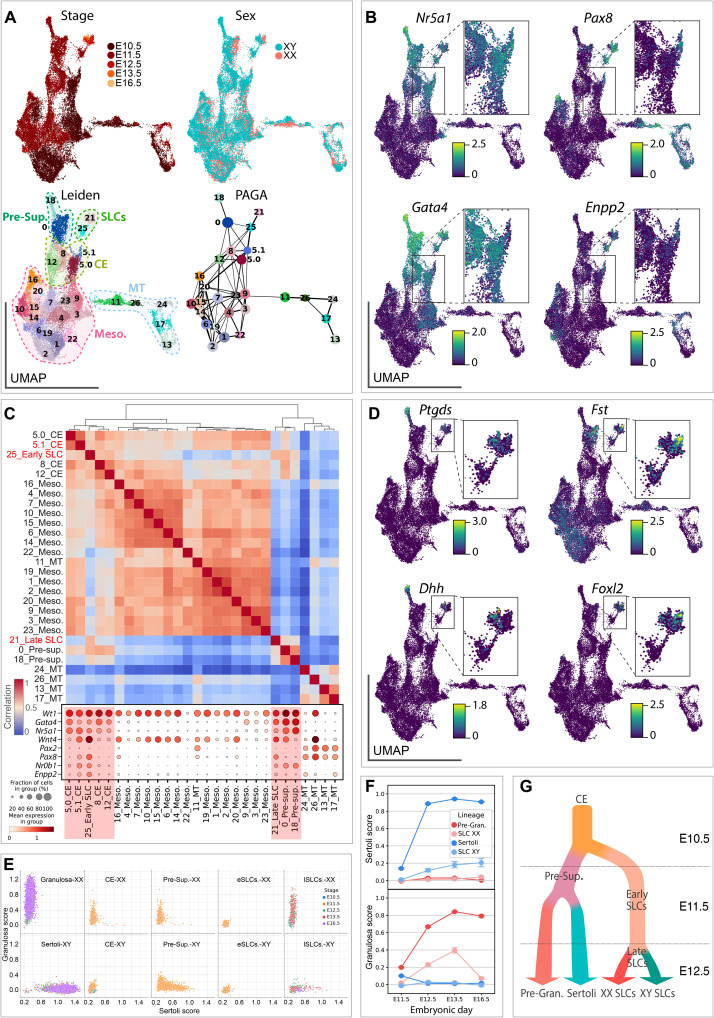
Fig. 3. Sex-specific differentiation of XX and XY SLCs.
(A) UMAP projection of SLC cell lineage colored by developmental stage, genetic sex, and annotation. Leiden clustering was applied to all cells, and a subclustering was applied to cluster #5, dividing it into two (#5.0 and #5.1). The fourth panel shows the PAGA graph representation where each node is a Leiden cluster, and the links between clusters represent confidence of relation between two clusters. (B) UMAP representation colored by expression levels (log-normalized counts) of CE-derived markers Nr5a1 and Gata4, and SLC markers Pax8 and Enpp2. (C) Heatmap showing correlation between transcriptomes of the different clusters. Populations were ordered using hierarchical clustering based on correlation (Spearman) distance of expression levels between cell populations. Dotplot representation of the expression of marker genes in each Leiden cluster. The size of the node represents the percentage of cells in the cluster expressing the gene, and the color indicates the level of expression (log-normalized counts). (D) UMAP representation colored by expression levels (log-normalized counts) of Sertoli cell markers Ptgds and Dhh, and granulosa cell markers Fst and Foxl2. (E) Scatterplots representing pregranulosa and Sertoli scores of individual cells using a LASSO model. A plot was generated for each cell type, and individual cells were colored by developmental stage. (F) Point plots showing pregranulosa and Sertoli cell scores in XX and XY SLC and supporting cells across time. (G) Schematic model of SLC and supporting lineage specification.

