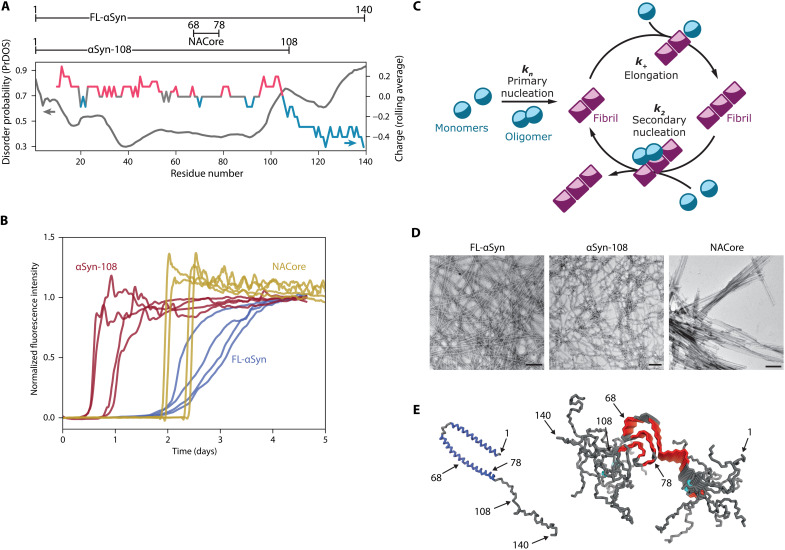
Fig. 1. Amyloidogenic αSyn variants used in this study.
(A) Variants of αSyn used in the study and predicted disorder along the protein chain (PrDOS, in gray) (75) and distribution of charged residues (in color). For comparison of predicted disorder using different online tools, please see the Supplementary Materials and fig. S1. (B) Aggregation traces (normalized ThT fluorescence intensity) for various αSyn variants (recorded for 40 μM concentration of FL-αSyn and αSyn-108 and for 160 μM concentration of NACore), without coacervates. (C) Schematic depiction of the basic protein aggregation cycle model used in this study. (D) TEM images of fibrils formed by studied variants. Scale bars, 200 nm. (E) FL-αSyn conformation when bound to lipids [left, Protein Data Bank (PDB) ID: 1XQ8] and stacked in amyloid fibrils (right, PDB ID: 2N0A); relevant residues are indicated.

