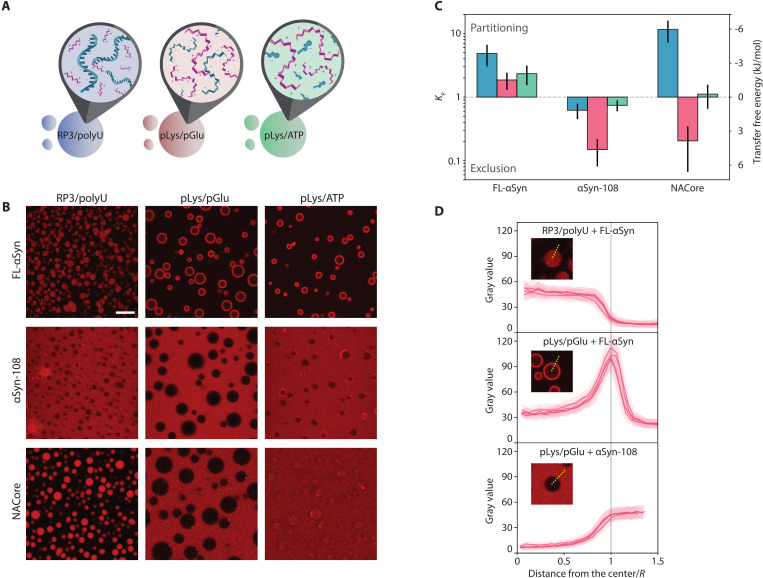
Fig. 2. Coacervate systems and interactions with αSyn variants.
(A) Schematic depiction of coacervate systems used in the study. (B) Confocal microscopy images of coacervate systems with labeled αSyn variants [Alexa Fluor 647–labeled S9C-FL-αSyn and S9C-αSyn-108 and carboxytetramethylrhodamine (TAMRA)–labeled NACore]. Scale bar, 20 μm. (C) Partition coefficient and transfer free energy (dilute phase-coacervate) determined from microscopy experiments. (D) Gray value profiles (angular averaging) of coacervate droplets from selected systems.

