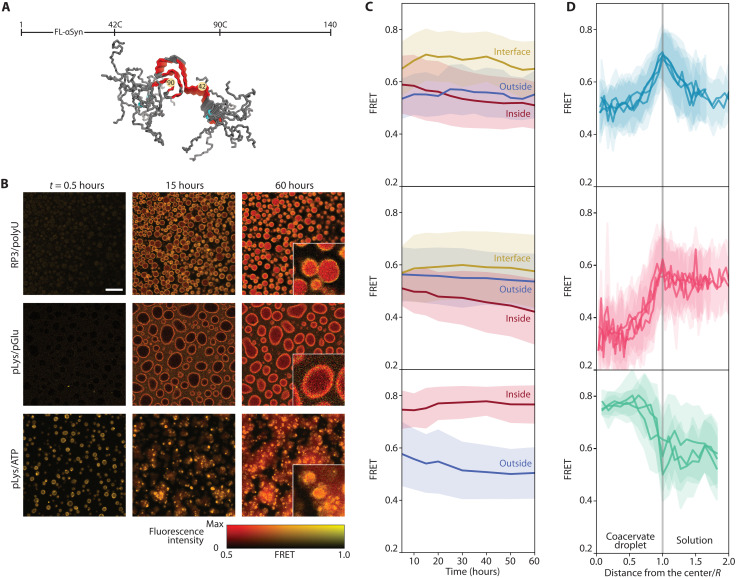
Fig. 5. Aggregation monitored by FRET.
(A) Positions of FRET labels in the FL-αSyn chain (PDB ID: 2N0A). (B) FRET maps of coacervate samples incubated with FRET-labeled FL-αSyn. Scale bar, 20 μm. Insets show three times enlarged part of the image at 60 hours; the experiment was performed in the presence of the FRET probe and 10 μM (RP3/polyU and pLys/ATP) or 40 μM (pLys/pGlu) concentration of nonlabeled FL-αSyn. (C) Changes in FRET intensity in different areas of the coacervate systems over time. (D) FRET intensity radial profiles for coacervate droplets after 60 hours of incubation (distance from the droplet center normalized by the droplet diameter, angular averaging).

