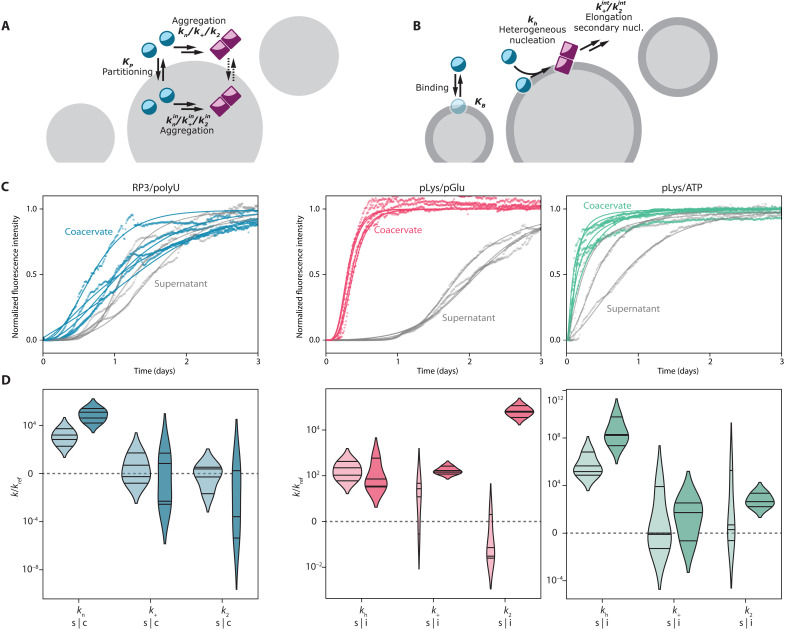
Fig. 6. Fitting of the aggregation models.
(A) Schematic depiction of the aggregation-in-droplets model. (B) Schematic depiction of the interface-aggregation model. (C) Fits to the experimental data for RP3/polyU with FL-αSyn for the aggregation-in-droplets model and fits to the experimental data for pLys/pGlu and pLys/ATP with FL-αSyn for the interface-aggregation model. (D) Resulting aggregation kinetic rate constants, for the diluted-supernatant phase (s) and for the coacervate/interface phase (c/i), normalized by values for reference sample (without coacervate components). Violin plots were prepared analogously to plots in Fig. 4.

