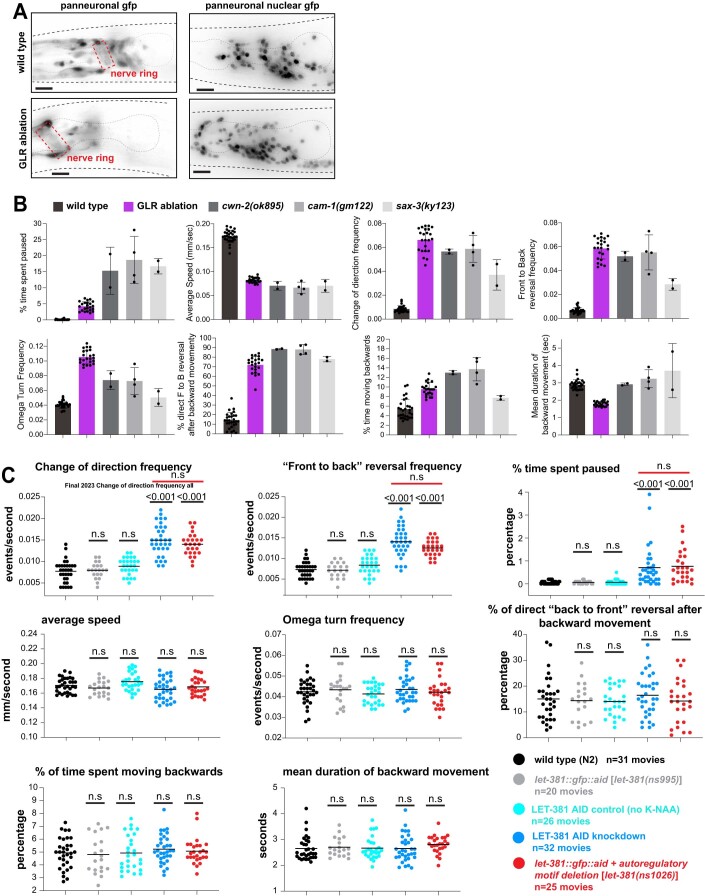
Figure EV5. Locomotion defects of GLR-ablated animals could partially be due to anteriorly displaced nerve ring.
(A) In wild-type animals (top row), axons of the nerve ring (dashed red box) are located between the two pharyngeal bulbs. In GLR-ablated animals (bottom row) the nerve ring is anteriorly displaced, located on top of the anterior pharynx bulb. As evidenced in the images on the right, not only the axonal projections, but also neuronal cell bodies (panneuronal nuclear gfp) are anteriorly displaced. Panneuronal gfp = unc-119prom::gfp, panneuronal nuclear gfp = rab-3prom1::nls::yfp. (B) cwn-2(ok895), cam-1(gm122), sax-3(ky123) mutants with anteriorly displaced nerve rings exhibit locomotion defects to the same direction, although of different magnitude as the GLR glia-ablated animals. (C) Auxin (K-NAA) dependent LET-381::AID knockdown results in similar defects in the same locomotion parameters as the let-381(ns1026) autoregulatory mutation. Genotypes are: wild-type N2 (black), let-381(ns995) control (gray), LET-381::AID knockdown [let-381(ns995);nsIs879 (nep-2prom7::TIR1)] exposed to K-NAA auxin (dark blue), LET-381::AID control [let-381(ns995) ; nsIs879 (nep-2prom7::TIR1)] not exposed to K-NAA auxin (light blue) and let-381(ns1026) autoregulatory mutation (red). Data information: in (B) wild type n = 29 movies, GLR ablation n = 23 movies, cwn-2(ok895) n = 2 movies, cam-1(gm122) n = 4 movies, sax-3(ky123) n = 2 movies. Bar height indicates average (center of error bars) and error bars show standard deviation in (B). Unpaired t test used for statistical analysis in (C); controls (gray and light blue) were compared to wild type (black). LET-38::AID knockdown (dark blue) was compared to its control group (light blue) and let-381(ns1026) was compared to its control (gray). No statistically significant differences were observed between the LET-381::AID knockdown and let-381(ns1026) as indicated by the red line on the top of the three upper diagrams. Anterior is left, dorsal is up and scale bars are 10 μm for all animal images.

