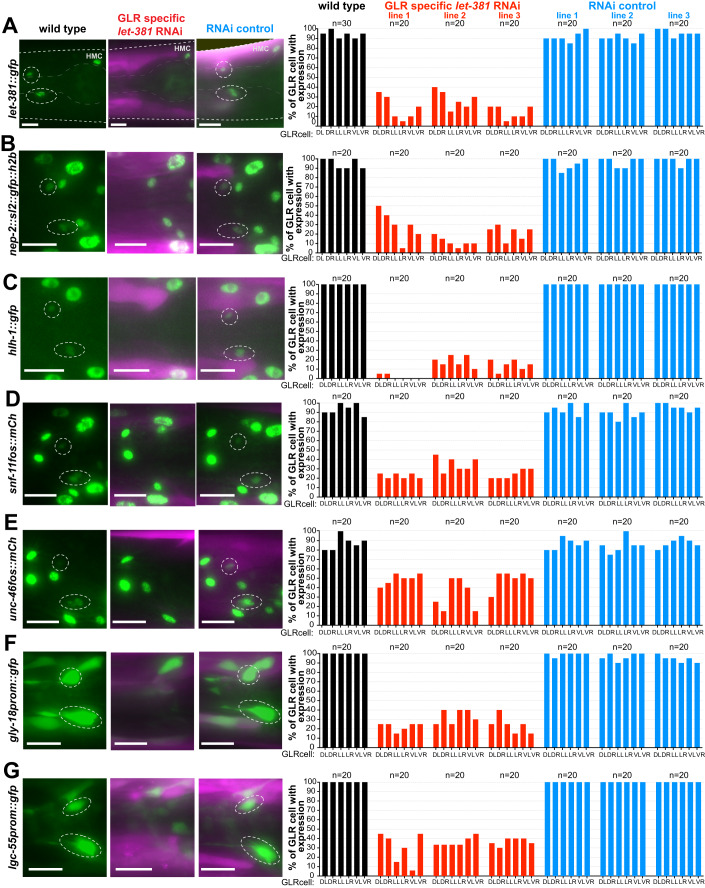
Figure 3. Postembryonic let-381 knockdown affects GLR glia gene expression.
(A–G) gfp or mCherry-based reporter expression (green) in GLR glia of endogenously tagged (A) let-381, (B) nep-2, and (C) hlh-1 and transgenic (D) snf-11 (E) unc-46, (F) gly-18, and (G) lgc-55 in wild-type (left column), GLR-specific postembryonic let-381 RNAi (middle column) and RNAi control animals (right column). Fluorescence images of L4 animals are shown. GFP expression in GLR glia (dashed white circles) is downregulated in the let-381 RNAi animals but not affected in RNAi control. RNAi and control lines carry a co-injection marker expressed in body wall muscle (magenta). Quantification is shown in bar graphs on the right. Each bar represents % of expression in each of the six GLR glia (DL, DR, LL, LR, VL, VR) in the three different backgrounds (wild type = black, GLR-specific RNAi = red, RNAi control = blue). Three independent extrachromosomal lines were scored for the RNAi and RNAi controls. Data information: anterior is left, dorsal is up, and scale bars are 10 μm for all animal images. Source data are available online for this figure.

