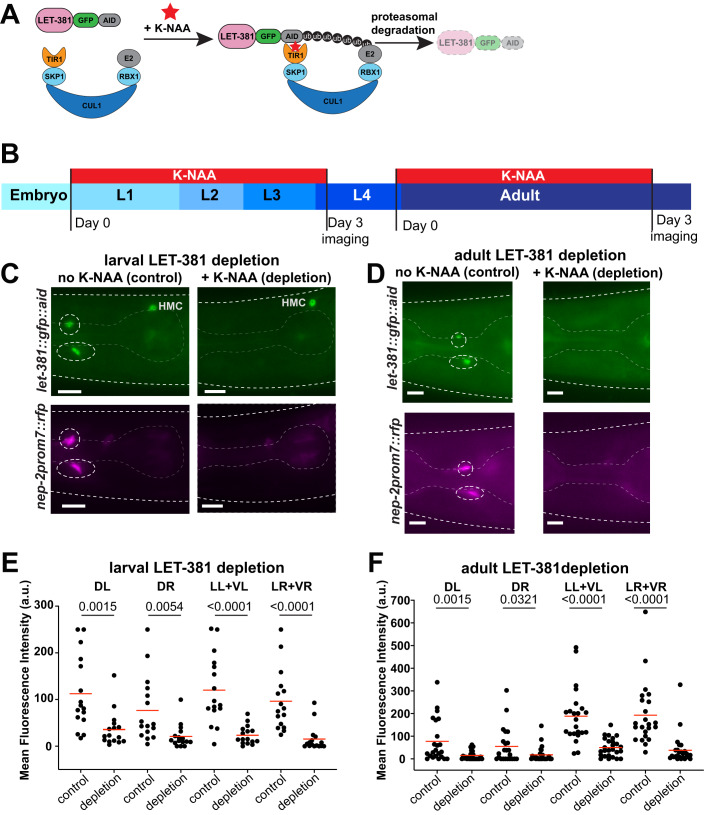
Figure 4. Acute larval and adult LET-381 depletion results in loss of GLR gene expression.
(A) Schematic representation of auxin-induced degradation (Zhang et al, 2015) of LET-381. TIR1 is transgenically provided and expressed specifically in GLR glia by the nep-2prom7 promoter. (B) Timeline of the auxin-inducible depletion experiment. Synchronized populations of L1 or late-L4/Young-adult animals were placed on plates containing the auxin analog K-NAA and imaged after a three-day exposure to K-NAA. Fluorescence intensities of gene expression in GLR glia were compared to age-matched animals grown on control plates without K-NAA. (C, D) Fluorescence images showing the result of (C) larval and (D) adult depletion of LET-381 using auxin-inducible degradation. Animals grown on control plates without K-NAA (left panels) show expression of let-381::gfp (green) and nep-2prom7::rfp (magenta) in GLR glia (dashed white circles). Age-matched animals grown on K-NAA-containing plates (right panels) show depletion of endogenous let-381::gfp expression specifically in the GLR glia; as shown expression in HMC remains unaffected. As a result, expression of the GLR-specific nep-2prom7::rfp reporter is downregulated in GLR glia. (E, F) Quantification (mean fluorescence intensity in cell bodies) of (E) larval and (F) adult LET-381 depletion on expression of nep-2prom7::rfp reporter in each GLR glia. Cell bodies of Lateral and Ventral GLR glia are too close to be clearly distinguished, thus they were grouped (LL + VL, LR + VR) for quantification purposes for this experiment. Red lines in dot plots indicate averages. Data information: unpaired t test used for statistical analysis in (E, F). n = 16 for control and depletion in (E), n = 23 for control and n = 26 for depletion in (F). a.u. = arbitrary units. Anterior is left, dorsal is up and scale bars are 10 μm for all animal images. Source data are available online for this figure.

