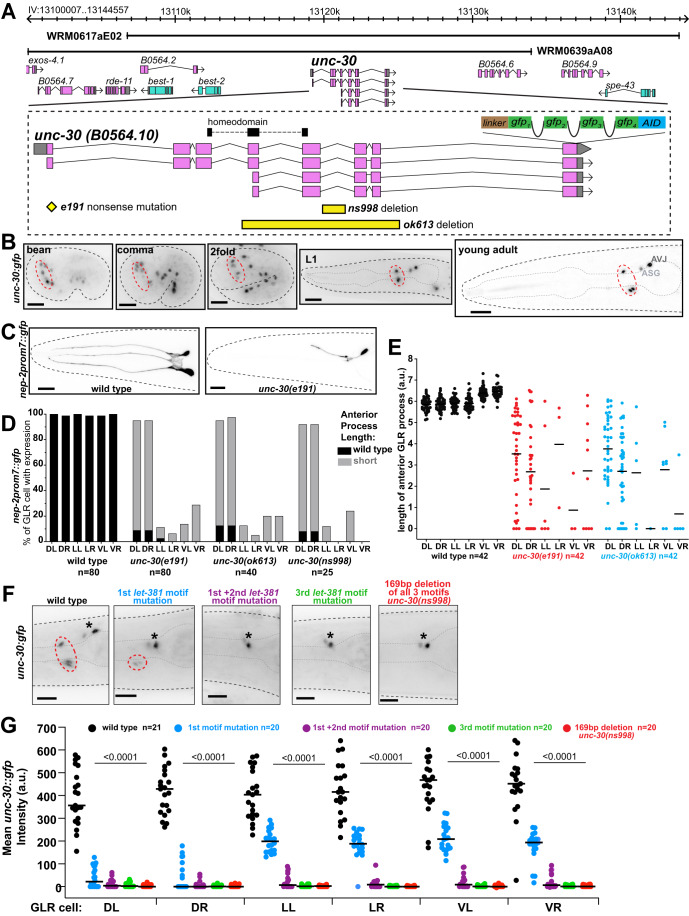
Figure 7. unc-30 acts downstream of let-381 to control GLR glia gene expression and the length of GLR anterior process.
(A) unc-30 genomic locus showing mutant alleles, reporters, fosmid genomic clones used in this study. (B) Expression of the endogenous unc-30::gfp reporter at different stages during development. Dashed red circles outline GLR glia. (C) nep-2prom7::gfp expression in a wild-type L4 (left) and a unc-30(e191) null mutant L4 animal (right). GFP expression is lost in the lateral and ventral GLR glia in unc-30(e191). The anterior process of the dorsal GLR glia still expressing GFP is shorter than that of a wild-type animal. (D) Quantification of percentage of each GLR glia cell with nep-2prom7::gfp expression (L4 stage) for different unc-30 mutant backgrounds. (E) Quantification of the length of GLR anterior processes (L4 stage) for different unc-30 mutant backgrounds. (F) Images of L4 animals showing differences in endogenous unc-30::gfp expression upon mutation of the let-381 motifs present in the fifth intron of unc-30. Dashed red circles outline GLR glia and black asterisks denote expression in the ASG and AVJ head neurons. (G) Quantification of unc-30::gfp fluorescence intensity for each GLR glia cell; black lines in bar graphs indicate averages. Data information: unpaired t test used for statistical analysis in (G). a.u. = arbitrary units. Anterior is left, dorsal is up, and scale bars are 10 μm for all animal images. Source data are available online for this figure.

