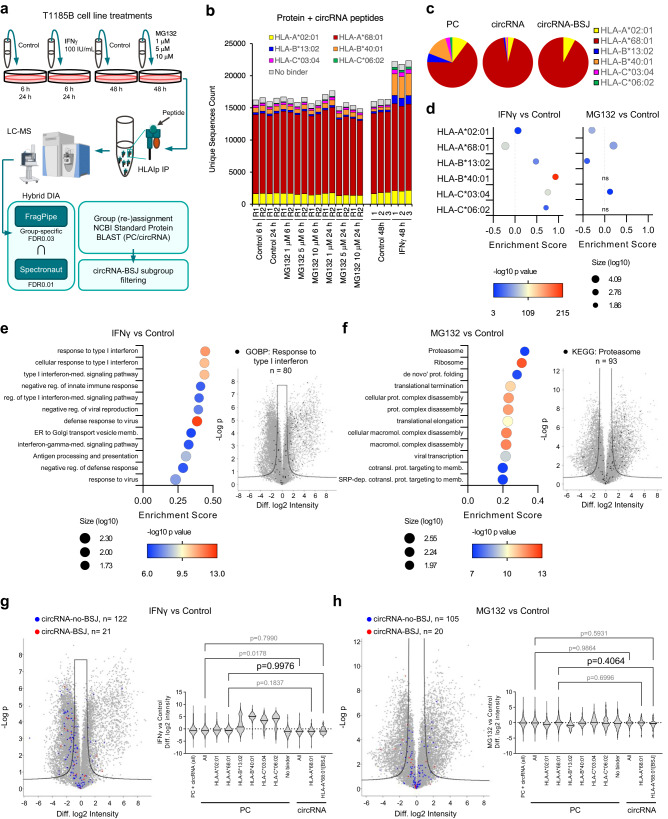
Fig. 4. IFNγ or MG132 treatments similarly impacted the presentation of circRNA-derived and PC peptides in T1185B cells.
a The immunopeptidomics experimental design for the MG132 and IFNγ treatments. Peptide identification was done by hybrid DIA analyses using FragPipe and Spectronaut MS tools and a concatenated UniProt and trimmed circRNA-derived ORFs around the BSJ fasta file. Schema was partially created with BioRender.com. b Number of unique peptides identified by both tools in each sample, colored based on their predicted HLA restriction. c PC, circRNA, and circRNA-BSJ derived peptides predicted by NetMHCpan4.1 to bind (% rank< 2) the respective HLA-I alleles (best % rank score). d Enrichment analysis comparing peptide intensities in IFNγ versus Control (left) and MG132 versus Control (right) treatments, annotated based on their HLA restriction (two-sided Wilcoxon-Mann-Whitney test, 1D annotation enrichment). e GOBP, GOCC and KEGG enrichment analysis (left) of differentially presented peptides upon IFNγ treatment (two-sided Wilcoxon-Mann-Whitney test, 1D annotation enrichment, peptide number≥50; Benj. Hoch. FDR < 1E-04; top 12 categories). A volcano plot depicting differential presentation analysis (right) of the effect of IFNγ on the immunopeptidomes, highlighting the most enriched GOBP category (Student’s t-test FDR0.01, s0 = 0.75). f Enrichment analysis (left) of differentially presented peptides upon MG132 treatment (two-sided Wilcoxon-Mann-Whitney test, 1D annotation enrichment, Benj. Hoch. FDR < 1E-04; top 12 categories). A volcano plot depicting differential presentation analysis (right) of the effect of MG132 on the immunopeptidomes, highlighting the most enriched KEGG category (Student’s t-test FDR0.01, s0 = 0.75). g Differential presentation of circRNA-derived peptides upon IFNγ treatment (Student’s t-test FDR0.01, s0 = 0.75, left) and associated violin plot showing the difference in the log2 intensity of the peptides associated with their HLAs (one-way ANOVA and Sidak’s multiple comparisons test, right). Due to the overrepresentation of HLA-A*68:01 in circRNA and circRNA-BSJ groups shown in c, only this HLA allele is represented for circRNAs. h Same as (g), for the MG132 treatment. In the volcano plots, peptides derived from proteins annotated as response to type I interferon or proteasome are highlighted in black, while circRNA-no-BSJ peptides and circRNA-BSJ are highlighted in blue and red, respectively. Source data are provided as a Source Data file.

