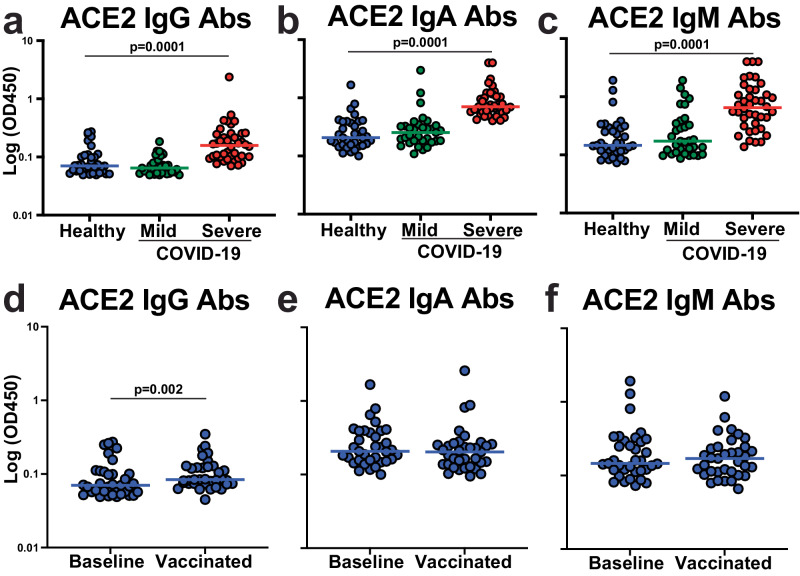
Fig. 1. ACE2 autoantibody levels are increased in severe COVID-19.
a–f Dot plot graphs of OD450 values on the log axis obtained by ELISA for determining the levels of antibodies targeting ACE2 within plasma from healthy individuals (n = 35, blue), individuals with mild COVID-19 (not hospitalized, n = 33, green), and individuals with severe COVID-19 (hospitalized, n = 40, red). Secondary detection antibodies specific for Ig isotype were utilized to identify IgG ACE2 antibody levels b IgA antibody levels, and c IgM antibody levels. d–f Dot plots showing ACE2 antibody levels in healthy individuals at baseline and then after two doses of Comirnaty COVID-19 mRNA vaccination. Ig isotype-specific ACE2 antibodies determined for d IgG e IgA and f IgM. Each dot represents a single individual, and Wilcoxon–Mann–Whitney statistical test was used to determine P values.

