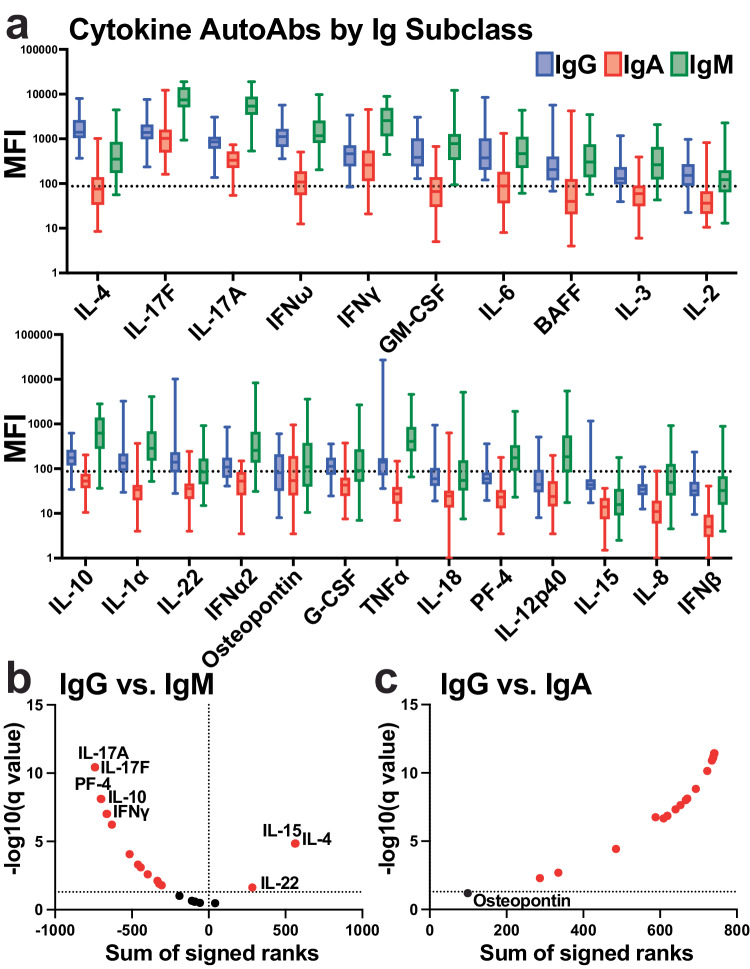
Fig. 4. Autoantibodies for cytokines, chemokines, and other immune factors were detected for different Ig isotypes within healthy individuals.
a Multiplex bead-based antibody binding assay measured the levels of autoantibodies against 23 cytokines, chemokines, and immune molecules for IgG (blue), IgA (red), and IgM (green) isotypes within healthy individual plasma samples (n = 38). Median fluorescent intensity (MFI) was calculated; background subtraction was used to remove nonspecific signals. Box and whisker plots are shown. The box shows the lower and upper quartile, with the median indicated by the solid line. The lines extending from the box (whiskers) indicate the upper and lower extreme values. The dashed line indicates a threshold determined by the sum of the mean and standard deviation for the negative control (i.e., beads without antigen). b, c Volcano plots showing the results of multiple Wilcoxon matched pairs test that was FDR corrected for multiple comparisons (Benjamini) that compared each analyte b IgG vs IgM autoantibody levels or c IgG vs. IgA autoantibody levels. The dotted lines indicate FDR < 0.01. Analytes highlighted in red are significantly changed between antibody isotypes compared.

