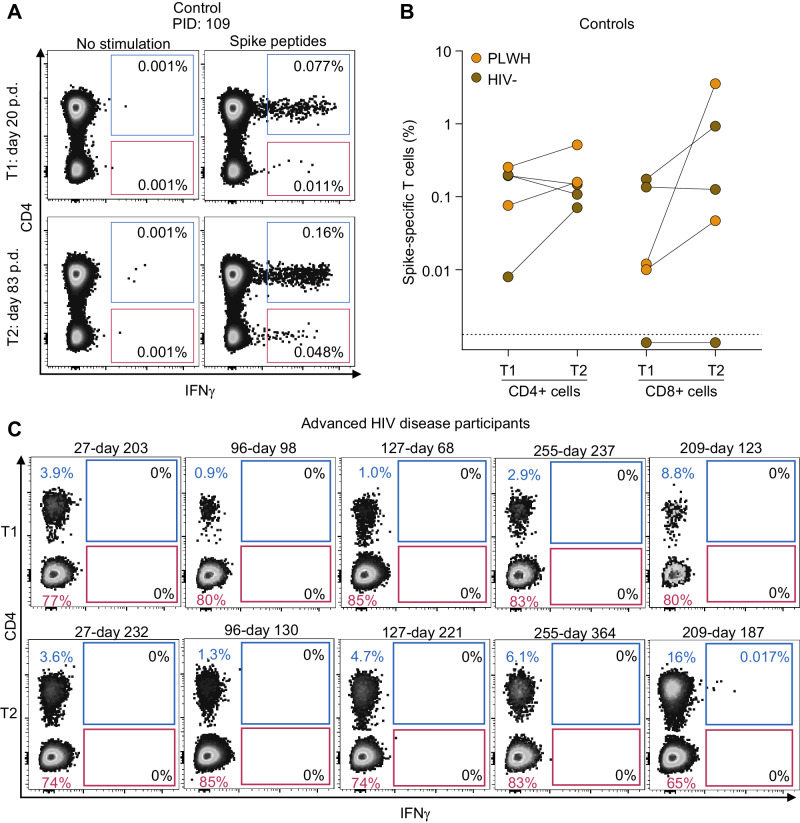
Fig. 3. SARS-CoV-2-specific T-cell responses in controls and advanced HIV disease.
A Flow cytometry results showing detection of SARS-CoV-2-specific responses in CD4 and CD8 T cells. T cells were stimulated with spike peptide pools matching the infecting variant and CD4 and CD8 T-cell responses detected by the presence of intracellular interferon-gamma (IFN-γ). The left plot shows unstimulated sample and right plot is 16 h post-peptide stimulation for control participant 109 (PID 109). p.d, days post-diagnosis. B CD4 and CD8 T-cell frequencies at two timepoints (T1, post infection; T2, post-vaccination) for each control participant (HIV-uninfected: brown points; controlled HIV: orange points). C Flow cytometry results showing CD4 (blue) and CD8 T-cell (red) frequencies in advanced HIV disease participants at two timepoints (T1, pre-SARS-CoV-2 clearance; T2, post-SARS-CoV-2 clearance). There was sufficient PBMC sample for one test per timepoint.

