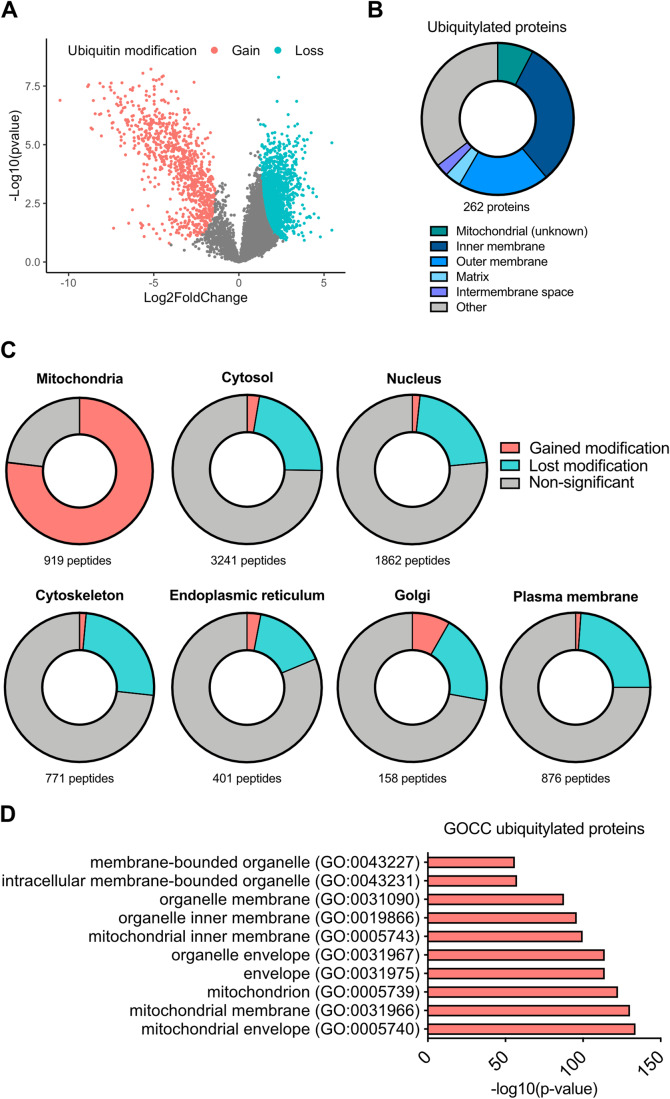
Figure 2. Widespread ubiquitylation of mitochondrial proteins after MOMP.
(A) Volcano plot of ubiquitylated proteins in SVEC4-10 cells treated for 3 h with 10 μΜ ABT-737, 10 μΜ S63845 and 30 μΜ Q-VD-OPh. The experiment performed with n = 4 independent repeats. Statistical analysis determining significance (coloured dots) was through using Student’s t test. Plot generated in RStudio. (B) Pie chart of ubiquitylated peptides categorised into mitochondrial compartments. Categorisation of peptides was performed using MitoCarta 3.0, UniProt and ProteinAtlas. (C) Cellular distribution of all hits from the isolated ubiquitin remnant-containing peptides. Categorisation using MitoCarta 3.0, UniProt and ProteinAtlas. (D) GO-term cellular compartment analysis of proteins with increased ubiquitylation after MOMP. Statistical analysis was performed with Fisher’s exact test with corrected with false discovery rate. Graphs shows the top ten most significant hits. Source data are available online for this figure.

