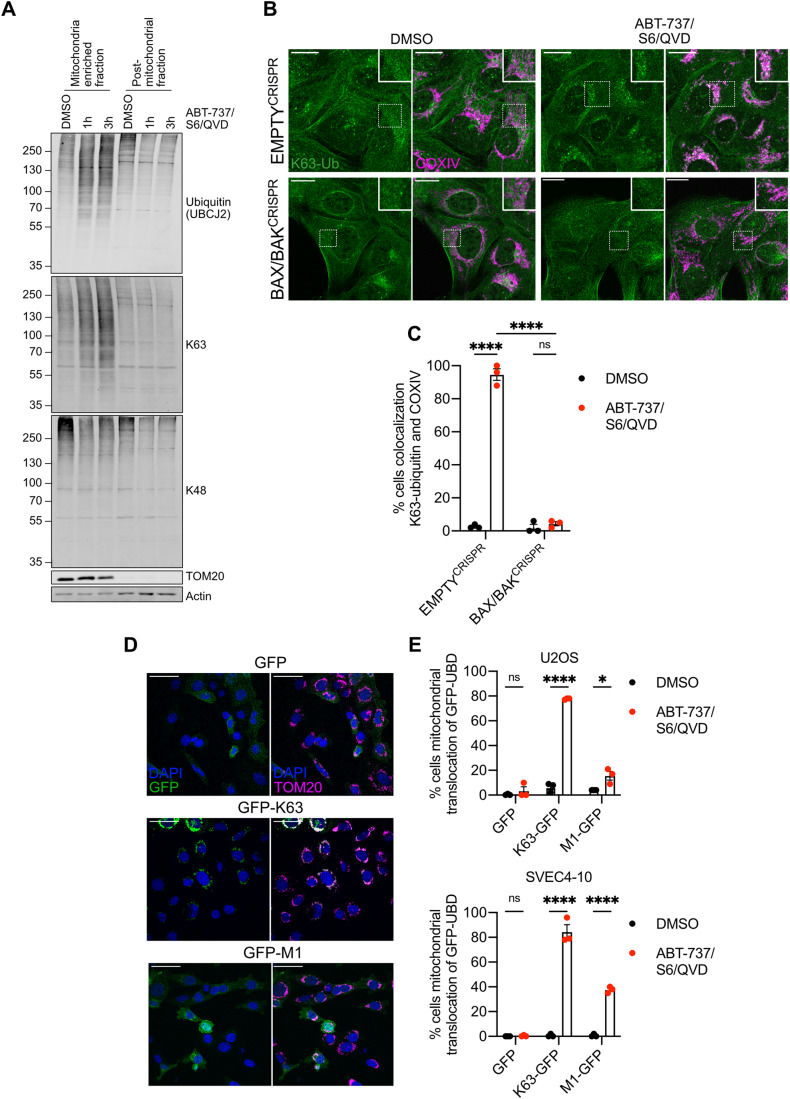
Figure 3. K63-linked ubiquitylation on mitochondria after MOMP.
(A) SVEC4-10 cells treated with for 1 or 3 h with 10 μΜ ABT-737, 10 μΜ S63845 and 30 μΜ Q-VD-OPh. Mitochondria were isolated using digitonin fractionation buffer and antibodies against ubiquitin (UBCJ2), K63- and K48-specific ubiquitin were used. Blots representative for three independent experiments. (B) U2OS EMPTYCRISPR and BAX/BAKCRISPR cells treated with 10 μΜ ABT-737, 2 μΜ S63845 and 20 μΜ Q-VD-OPh for 3 h. Stained for K63-ubiquitin and mitochondrial COXIV. Images are maximum projections of Z-stacks with a scale bar of 20 μm and are representative of three independent experiments. (C) Quantification of (B) showing the percentage of cells with mitochondrial localised K63-ubiquitin puncta. Statistics performed using two-way ANOVA with Tukey correction. (D) SVEC4-10 cells expressing doxycycline-inducible K63 or M1-UBDs. Cells were treated for 1 h with 10 μΜ ABT-737, 10 μΜ S63845 and 30 μΜ Q-VD-OPh. Images are representative of three independent experiments with a scale bar of 50 μm. (E) Quantification of (D) showing the percentage of SVEC4-10 cells with mitochondrial localised GFP-UBDs. Also includes the quantification of U2OS cells expressing doxycycline-inducible K63- or M1-UBDs treated for 3 h with 10 μΜ ABT-737, 2 μΜ S63845 and 20 μΜ Q-VD-OPh. Statistics were performed using multiple unpaired t tests. Data information: (C, E) graphs display mean values ± s.e.m. (error bars) of n = 3 independent experiments. **P < 0.01, ***P < 0.001. ****P < 0.0001. Source data are available online for this figure.

