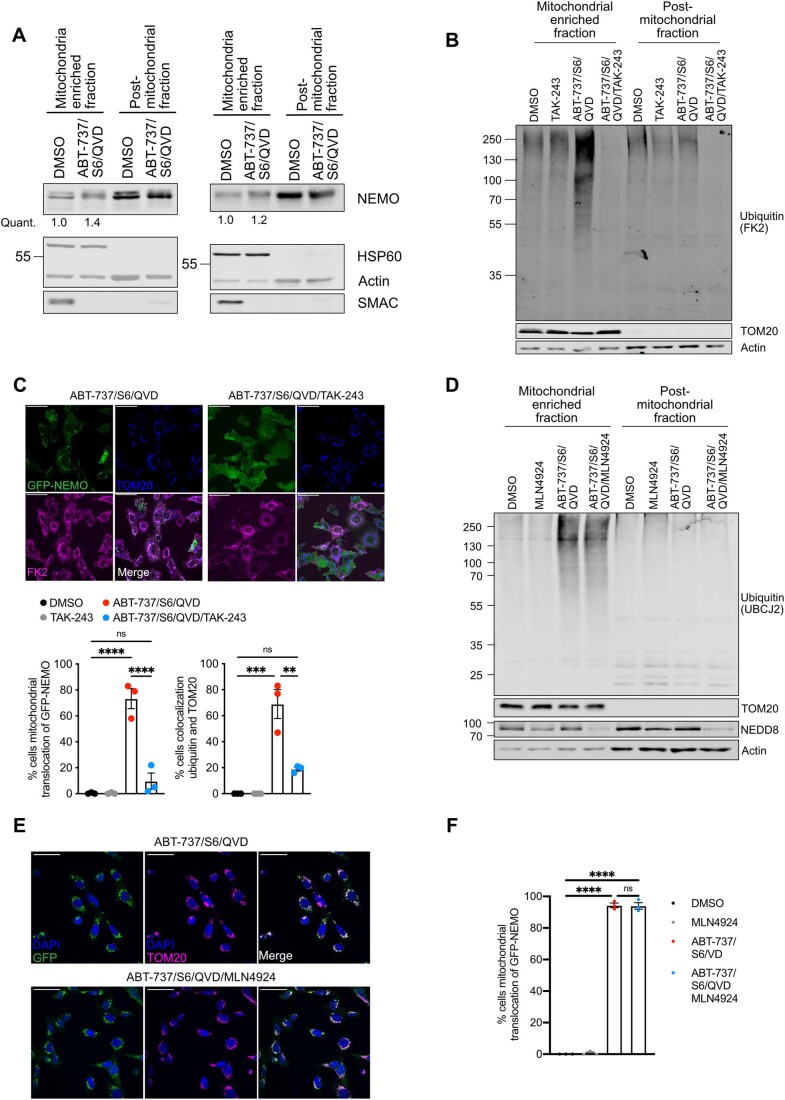
Figure EV2. Mitochondrial ubiquitylation and GFP-NEMO translocation can be blocked by E1 inhibition and is independent of neddylation.
(A) SVEC4-10 cells treated for 3 h with 10 μΜ ABT-737, 10 μΜ S63845 and 30 μΜ Q-VD-OPh. Mitochondria were isolated using Dounce homogeniser and cellular fractions were probed with relevant antibodies. Mitochondrial localised NEMO was quantified normalising to mitochondrial content defined by HSP60 signal. (B) SVEC4-10 cells pre-treated with 2 μΜ TAK-243 for 1 h followed by additional 1 h treatment with 10 μΜ ABT-737, 10 μΜ S63845 and 30 μΜ Q-VD-OPh with or without 2 μΜ TAK-243. Blots are representative for four independent experiments. (C) Upper: SVEC4-10 cells expressing GFP-NEMO were pre-treated for 1 h with 2 μΜ TAK-243 followed by 1 h treatment of 10 μΜ ABT-737, 10 μΜ S63845, 30 μΜ Q-VD-OPh with or without 2 μΜ TAK-243. Cells were immunostained for TOM20 and ubiquitin (FK2). Scale bar is 50 μm and images are representative for three independent experiments. Lower: quantification showing the percentage of cells with mitochondrial localised GFP-NEMO and ubiquitin puncta. (D) SVEC4-10 cells pre-treated with 1 μΜ MLN4924 (NAE inhibitor) for 1 h followed by additional 1 h treatment with 10 μΜ ABT-737, 10 μΜ S63845 and 30 μΜ Q-VD-OPh with or without 1 μΜ MLN4924. Blots are representative for two independent experiments. (E) SVEC4-10 cells expressing GFP-NEMO pre-treated with 1 μΜ MLN4924 for 1 h followed by additional 1 h treatment with 10 μΜ ABT-737, 10 μΜ S63845 and 30 μΜ Q-VD-OPh with or without 1 μΜ MLN4924. Cells were immunostained for mitochondrial TOM20 and DAPI. Images are representative for three independent experiments and are shown with a 50 μm scale bar. (F) Quantification of (E) showing the percentage of cells with mitochondrial translocation of GFP-NEMO. Data information: graphs in (C, F) display mean values ± s.e.m. (error bars) of n = 3 independent experiments. Statistics were performed using two-way ANOVA with Tukey correction. ****P < 0.0001.

