
FIGURE 3.
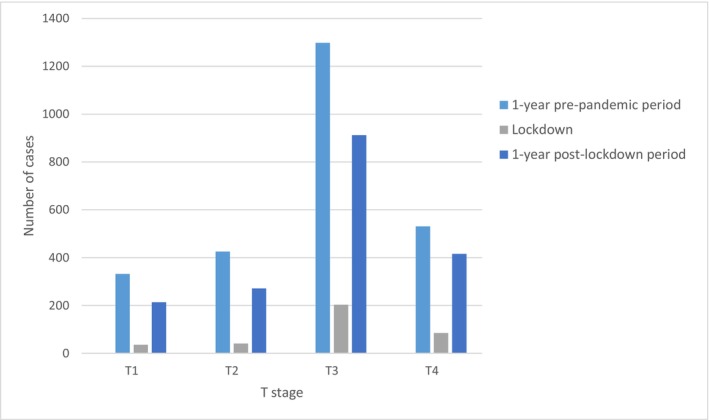
Diagnosis of the different T stages at different stages before and during the prepandemic and pandemic periods. The number of diagnoses was reduced during lockdown.
Official websites use .gov
A
.gov website belongs to an official
government organization in the United States.
Secure .gov websites use HTTPS
A lock (
) or https:// means you've safely
connected to the .gov website. Share sensitive
information only on official, secure websites.
Diagnosis of the different T stages at different stages before and during the prepandemic and pandemic periods. The number of diagnoses was reduced during lockdown.