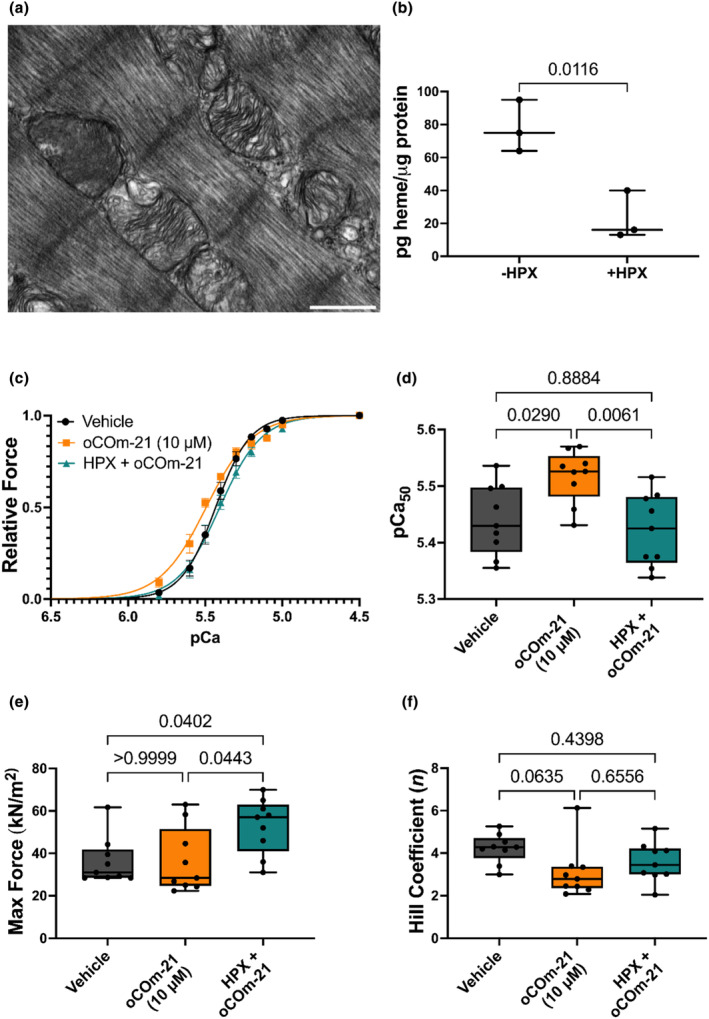
FIGURE 3.

HPX prevents the Ca2+ sensitizing effect of oCOm‐21 (10 μM). (a) Electron micrograph of interfibrillar mitochondrial structures in a permeabilized cardiomyocyte at 33,000× magnification; scale bar shown represents 500 nm. (b) Fluorescence analysis of heme content in both untreated and HPX treated (1 μM) permeabilized cardiomyocytes. (c) Force‐pCa relationships of permeabilized cardiomyocytes treated with vehicle, oCOm‐21 (10 μM) or HPX (1 μM) + oCOm‐21 (10 μM). (d) pCa50 values for each treatment. (e) Max force values for each treatment. (f) Hill coefficient values for each treatment group. Individual cell data points in (d–f) are denoted using black solid circles. Data in (b) is expressed as a Box and Whiskers plot representing the median and interquartile range, n = 3 hearts/group, significance determined by an unpaired t‐test. Data in (c) is expressed as the means ± S.E.M while data in (d–f) is expressed as a Box and Whiskers plot representing the median and interquartile range, n = 9 cells/group obtained from three hearts. Significance was determined using a One‐way ANOVA with Bonferroni post hoc test and p is represented on each experimental group.
