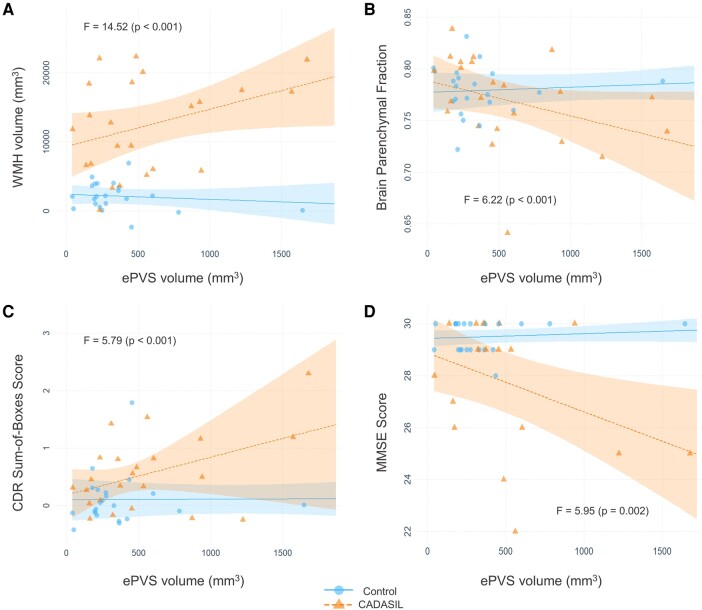
Figure 2.
Interaction plots with lines fitted for the CADASIL diagnosis and ePVS interaction models. Points represent partial residuals and shaded areas 95% confidence intervals. F-statistics for each model are also presented. Graphs illustrate the results of (A) adjusted model with WMH volume as outcome, (B) adjusted model with BPF as outcome, (C) adjusted model with CDR-SB score as outcome and (D) unadjusted model with MMSE score as outcome. The point of one control participant with relatively large ePVS volume is not shown due to size constraints. BPF, brain parenchymal fraction; CDR, Clinical Dementia Rating; ePVS, enlarged perivascular space; MMSE, Mini-Mental State Examination; WMH, white matter hyperintensity.

