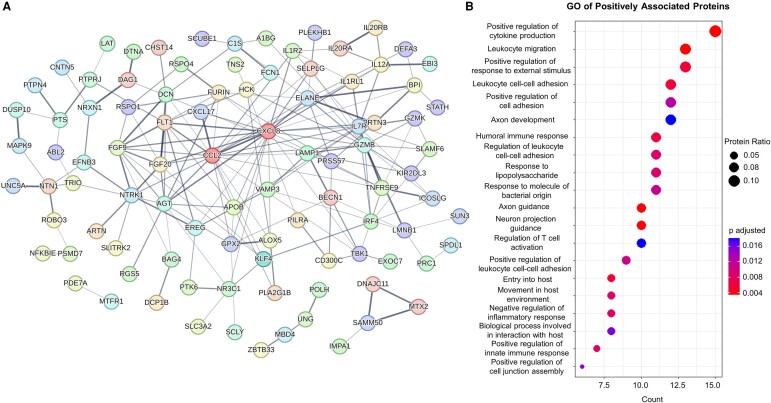
Figure 3.
PPI and GO analysis of proteins positively associated with ePVS volume. (A) Interaction network between positively associated proteins. The proteins with most interactions (CCL2–24 edges, CXCL8–23 edges) are coloured in dark red. See Supplementary Table 1 for protein abbreviation list. (B) Dot plot presenting the result of BP GO analysis for the all the positively associated proteins. Intensity of edges in the interaction plots denotes confidence. Proteins with no interactions are not shown. For the GO analyses, only significant terms (adjusted P-value < 0.05) were included. Protein ratio is defined as the count of proteins in the term to the total number of proteins analysed. BP, biological process; GO, gene ontology.

