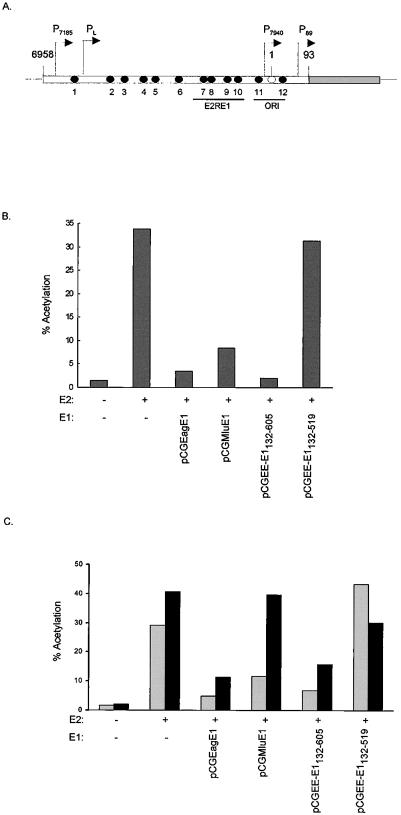
FIG. 3.
(A) Structure of the p1066 reporter plasmid. The open rectangle represents the LCR sequences, and the shaded rectangle represents the CAT gene. Filled circles represent the 12 E2 binding sites (12), and an open circle represents the E1 binding site. The E2-responsive element (E2RE1) (23), BPV-1 promoters, and the origin of replication (ORI) are also shown. (B) Repression by E1 of E2-transactivated P89 promoter activity. Results from a representative CAT assay are shown. The reporter plasmid p1066 was cotransfected into BEF cells with the indicated E1 and/or E2 (C59) expression vector. Each plasmid was tested in approximately 10 experiments. CAT activities are expressed as percentages of acetylation. (C) E1 repression of E2-transactivated CAT expression from heterologous promoters. The values were averaged from results of three experiments. Reporter plasmids p964 (shaded bars) and pTKM6 (filled bars) were cotransfected into BEF cells with the indicated E1 and E2 (C59) expression vectors. CAT activities are expressed as percentages of acetylation.

