Fig. 2.
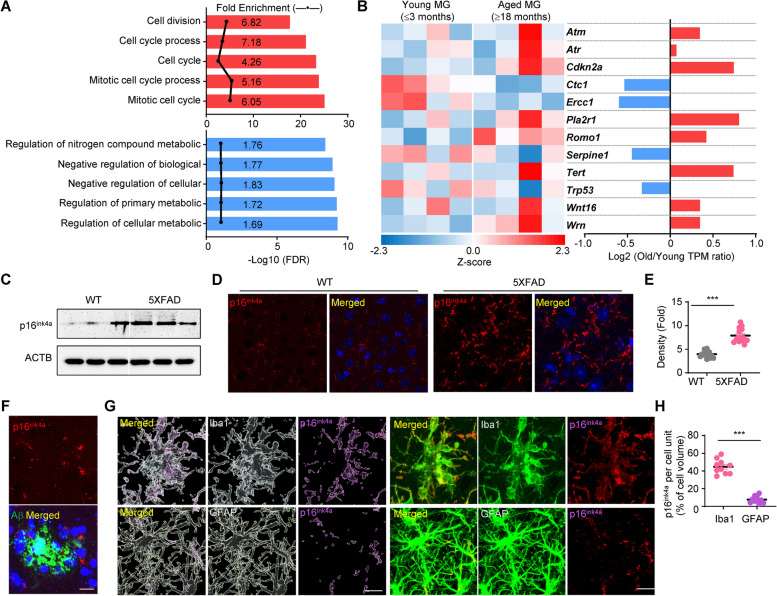
Cdkn2a and its coding protein p16ink4a are increased in senescent microglia, but not astrocytes or neurons, in postmortem brains of patients with Alzheimer’s disease and 8-month-old 5XFAD mice. A Top 5 gene ontology biological process pathways involved in Aβ42-positive microglia from old mice compared with young mice. The upper panel (red) and lower panel (blue) show the pathways enriched by increased and decreased gene expression, respectively. FDR: false discovery rate. B Heat map representing gene expression relating to replicative senescence (GO0090399) in Aβ42-positive microglia (MG) from young and old mice (n = 4 for each group). The scale represents the Z-score from 2.3 (highest expression) to − 2.3 (lowest expression). The bar graph reveals the ratio of the gene expression levels in Aβ42-positive microglia between young and old mice. C Western blot of the protein levels of p16ink4a in brain tissue from WT and 5XFAD mice. ACTB: β-actin. D Immunohistochemistry of p16ink4a and DAPI staining in brain tissue from WT and 5XFAD mice. Scale bar: 100 µm. E Quantification of the protein levels in (D). ***p < 0.005, 5XFAD versus WT; unpaired Student’s t test. F Z-stack confocal images of p16ink4a (red) with Aβ plaque (green). Scale bar: 20 µm. G Representative images show p16ink4a expression (purple) with Iba1 or GFAP immunostaining. Representative images were constructed using Imaris software. Scale bar: 20 µm. H The percentage of p16ink4a expression per cell volume. ***p < 0.005, Iba1 versus GFAP; unpaired Student’s t test

