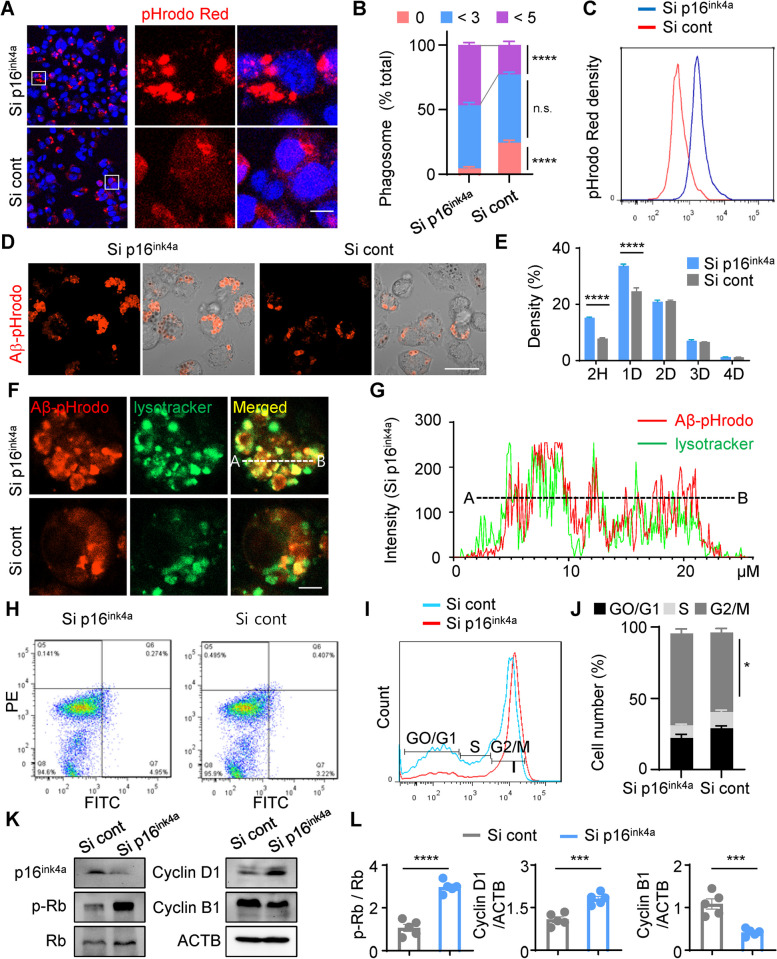
Fig. 6.
Downregulation of p16ink4a improves microglial BV2 cell proliferation and efficiently increases cellular phagocytosis and amyloid-β lysis. A Confocal images of BV2 cells transfected with p16ink4a siRNA or scrambled siRNA and, 48 h later, treated with pHrodo bioparticle conjugates for 3 h. Scale bar: 20 µm. B The percentage of the number of phagosomes in each BV2 cell, separated into groups of 0, < 3, and < 5 phagosomes per cell. Data were analyzed by 2-way ANOVA followed by the Tukey test for multiple comparisons. ****p < 0.001, versus scrambled siRNA. n.s.: not significant. C FACS analysis of pHrodo-treated BV2 cells. D BV2 cells transfected with siRNA were treated with Aβ-pHrodo for 1 h. Scale bar: 20 µm. E BV2 cells were treated with Aβ-pHrodo for 2 h, harvested, and analyzed by FACS immediately (2 h after treatment) and on days 1, 2, 3, and 4 after treatment. Data were analyzed by 2-way ANOVA followed by the Tukey test for multiple comparisons. ****p < 0.001, versus scrambled siRNA. D: day, H: hour. F Merged representative images of BV2 cells treated with Aβ-pHrodo and LysoTracker. Scale bar: 5 µm. G Analysis of the fluorescence intensity along the white line from A to B from the upper merged image in (F). H Representative FACS data of BV2 cells double-stained with annexin V and propidium iodide. The 4 populations are non-apoptotic dead cells (Q5), late-apoptotic cells (Q6), viable cells (Q8), and early-apoptotic cells (Q7). I Representative FACS data of the cell cycle phases of BV2 cells transfected with scrambled siRNA or p16ink4a siRNA. J The percentages of cells in G0/G1, S, and G2/M phases for p16ink4a siRNA-transfected BV2 cells compared with scrambled siRNA-transfected control BV2 cells. This experiment was repeated 3 times, and similar results were obtained each time. Data were analyzed by 2-way ANOVA followed by the Bonferroni test for multiple comparisons. *p < 0.05, versus scrambled siRNA. K Western blot of p16ink4a, p-Rb, Rb, cyclin D1, and cyclin B1 expression in BV2 cells. β-Actin (ACTB) was used as a protein loading control. L Quantification of the protein levels in (K) after siRNA transfection in BV2 cells. ***p < 0.005 and ****p < 0.001, versus scrambled siRNA; unpaired Student’s t test. Cont: control, Si: siRNA

