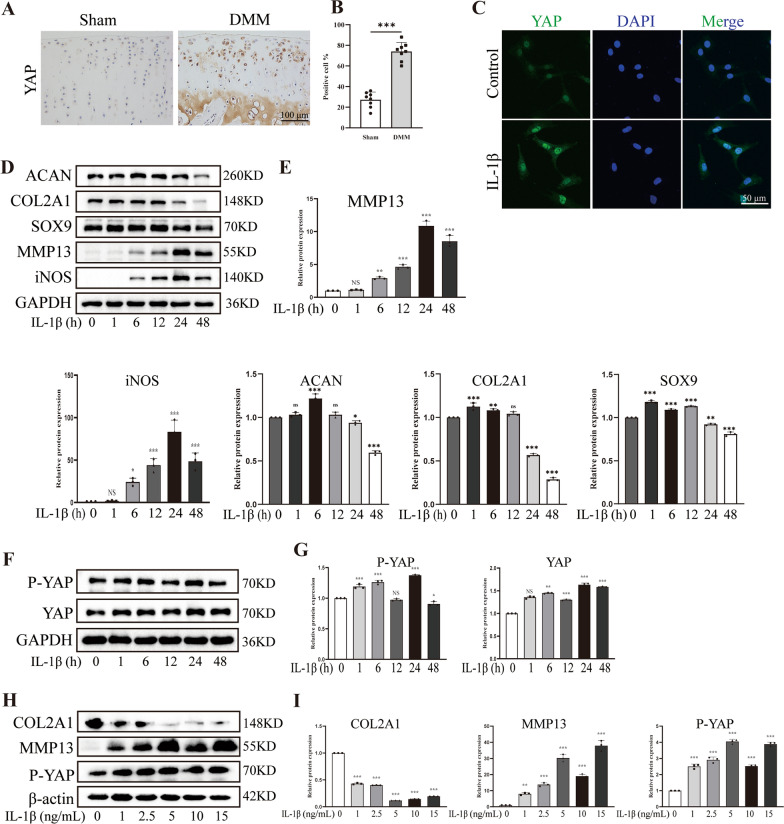
Fig. 1.
The expression of YAP in OA. A, B Immunohistochemistry images and quantitative analysis of YAP-positive cells in knee joint cartilage of rats (Sham group: n = 8; DMM group: n = 8, scale bar: 100 μm). C Immunofluorescence image of fluorescence intensity to show the relative expression of YAP in chondrocytes treated with IL-1β for 24 h (scale bar: 50 μm). D, E Western blot of the indicated protein level to demonstrate that IL-1β treat the chondrocytes for 0, 1, 6, 12, 24 and 48 h could cause inflammation of chondrocytes. F, G Western blot and quantitative analysis of P-YAP and YAP band density. H, I Western blot and quantitative analysis of COL2A1, MMP13 and P-YAP band density. Data are shown as mean ± SD. *P < 0.05, **P < 0.01, ***P < 0.001

