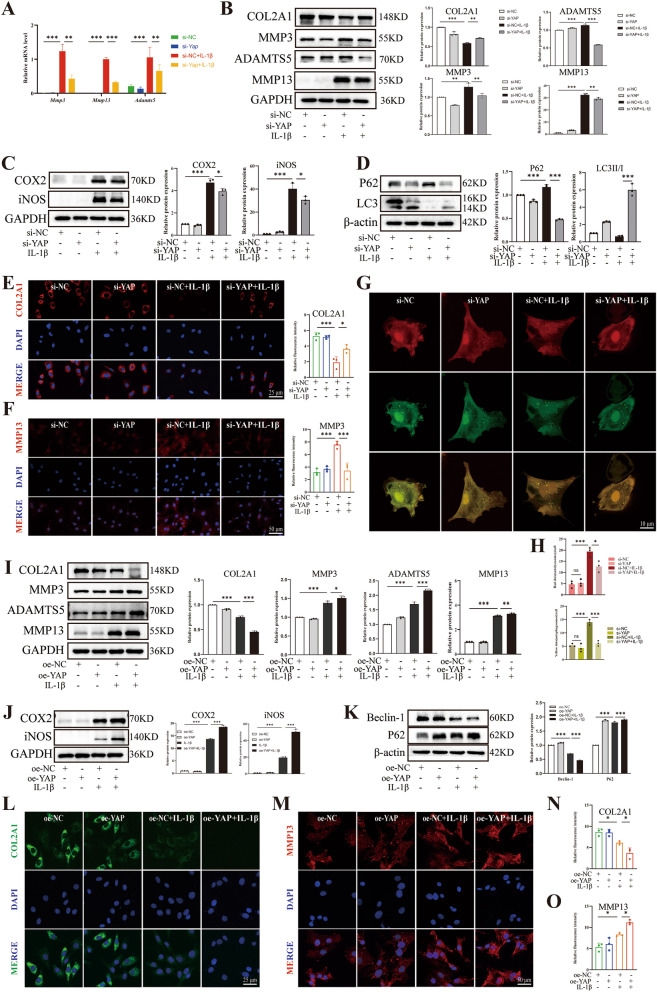
Fig. 3.
YAP exacerbated chondrocyte damage induced by IL-1β. Chondrocytes transfected with si-NC or YAP siRNA following IL-1β induction for 24 h. A qPCR of MMP3, MMP13 and ADAMTS5 relative expression level. B Western blot and quantitative analysis of COL2A1, MMP3, ADAMTS5 and MMP13 expression level. C, D Western blot and quantitative analysis of COX2, iNOS, P62 and LC3 expression level. E, F Immunofluorescence staining and fluorescence intensity analysis of COL2A1 and MMP13 relative expression level. G, H Chondrocytes were transfected with si-NC or si-YAP and then transfected with mRFP-GFP-LC3 adenovirus following IL-1β treatment for 24 h. The representative images of fluorescence and quantitative analysis of red dots and yellow dots were shown (scale bar: 10 μm). Subsequently, Chondrocytes transfected with oe-NC or oe-YAP following IL-1β induction for 24 h. I Western blot and quantitative analysis of COL2A1, MMP3, ADAMTS5 and MMP13 expression level. J, K Western blot and quantitative analysis of COX2, iNOS, Beclin-1 and P62 expression level. L–O Immunofluorescence staining and fluorescence intensity analysis of COL2A1 and MMP13 relative expression level. Data are shown as mean ± SD. *P < 0.05, **P < 0.01, ***P < 0.001

