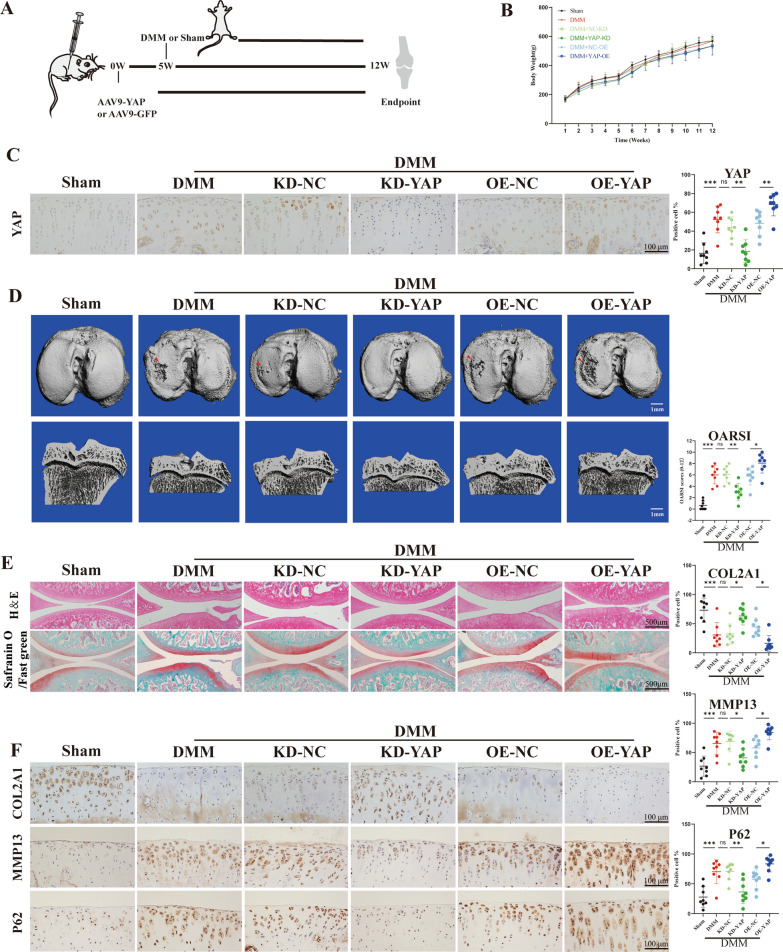
Fig. 4.
YAP overexpression exaggerates cartilage degeneration in post-traumatic OA rats. A Schematic diagram of animal experiment. B The body weight of rats. C IHC staining to show the YAP-positive cell in cartilage (scale bar: 100 μm). D The CT three-dimensional reconstruction images of rats (scale bar: 1 mm). E H&E staining and Safranin O/Fast green of the six groups (scale bar: 500 μm). F, G Immunohistochemistry staining to show the COL2A1-positive cell, MMP13-positive cell and P62-positive cell in cartilage of the six groups (scale bar: 100 μm). Data are shown as mean ± SD. *P < 0.05, **P < 0.01, *** P < 0.001

